Where To Next For The DXY?

I was chatting during the week with a trader who held a rather bullish view on the US$ index (DXY). This then led, in Yin and Yang fashion, to their reasoning for a pullback on Gold, as it negotiates the key $1,900 level, and on the commodity currencies. I always try to remain agnostic and to follow price action so thought a review of the technical situation on the DXY might be timely. The US$ index, the DXY, has been in decline for the last two months but has recently found some recent support near the 90 level. This whole-number level seems to be one key threshold level for the index and will be the horizontal support to watch in coming session; especially with the release this week of the US monthly NFP jobs report. In this post I review other key levels and trend lines on the charts of the DXY that might be worth monitoring over the coming weeks.
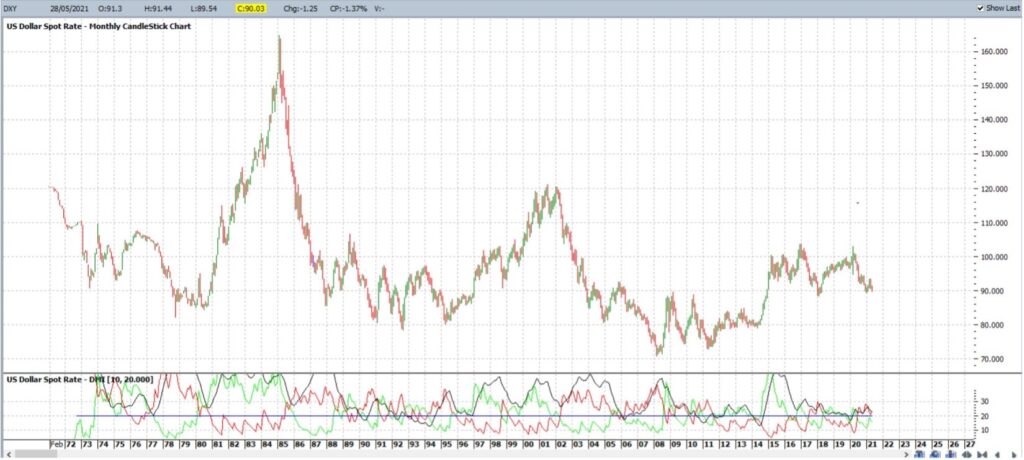
DXY monthly: the longer term activity on the monthly chart shows that price action has been in a kind of choppy decline as the print of lower Highs and lower Lows reveals.
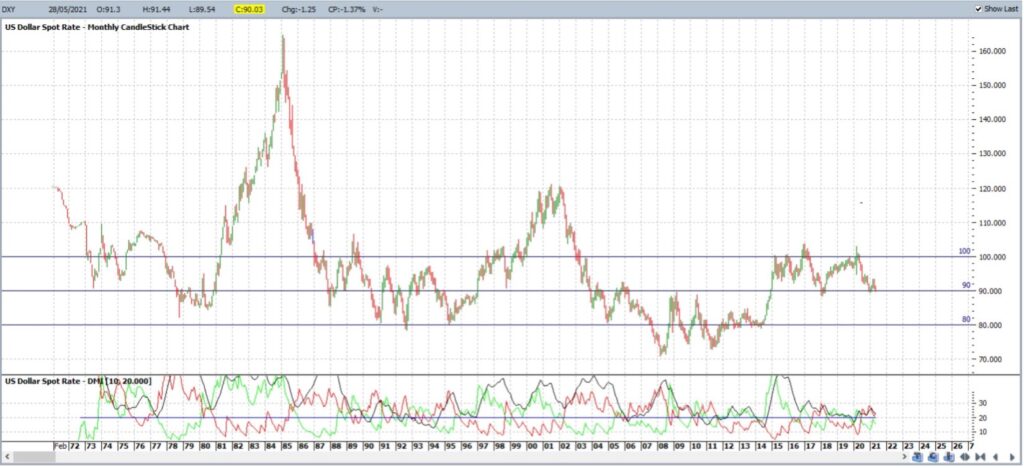
DXY monthly 2: the horizontal 100, 90 and 80 levels seem to be key reaction zones for the index:
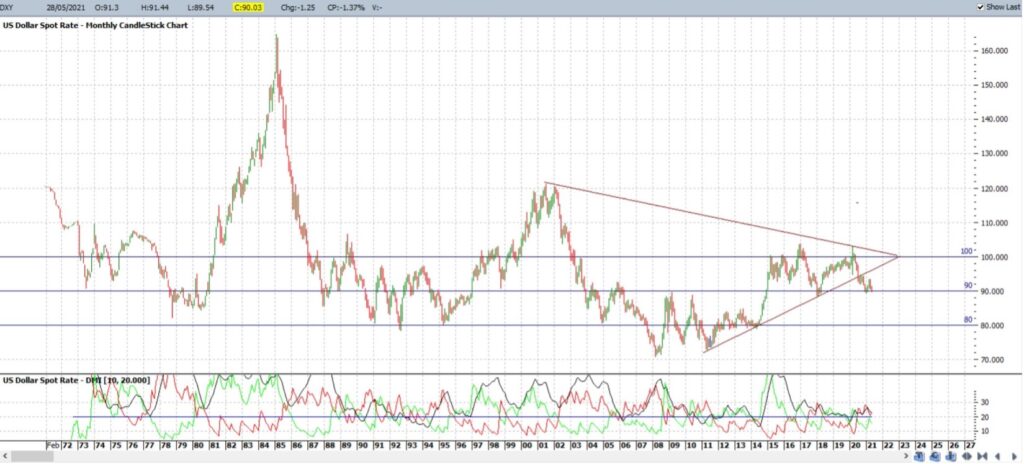
DXY monthly: The chart below reveals the major charting pattern I have had in play over recent months. This has been a Triangle pattern and the bottom trend line, of around 10-year duration, was broken last year. Note how this trend line break triggered along with a rise in bearish –DMI momentum (the red line in the lower pane). Bearish momentum remains above the 20 threshold on this monthly time frame for the time being.
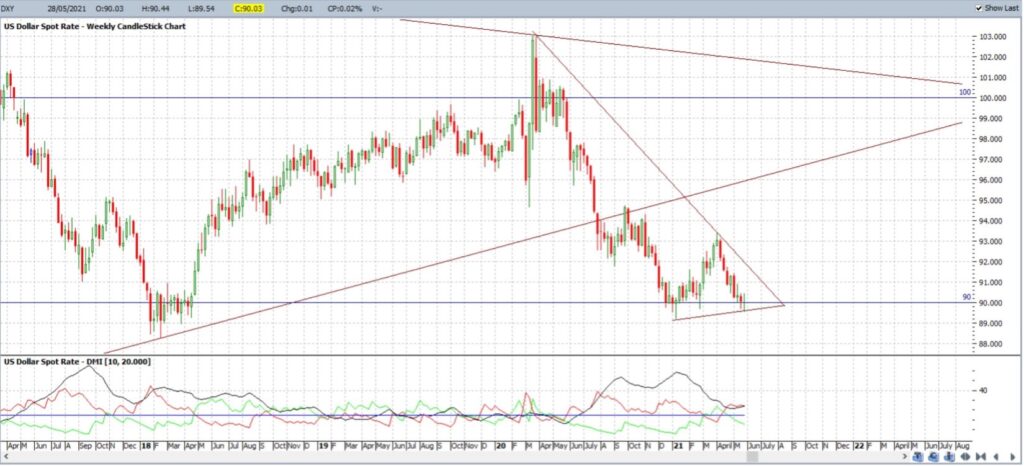
DXY weekly: Dropping down to the weekly chart shows this trend line break but, also, how the horizontal 90 level has acted as some decent support. I have also captured this recent Swing Low move, from 2020 -2021, in a separate triangle pattern. It is worth noting that bearish momentum remains above the 20 threshold on this weekly time frame for the time being as well. Any break of this weekly chart support trend line would eventually bring the horizontal 80 level back into focus.
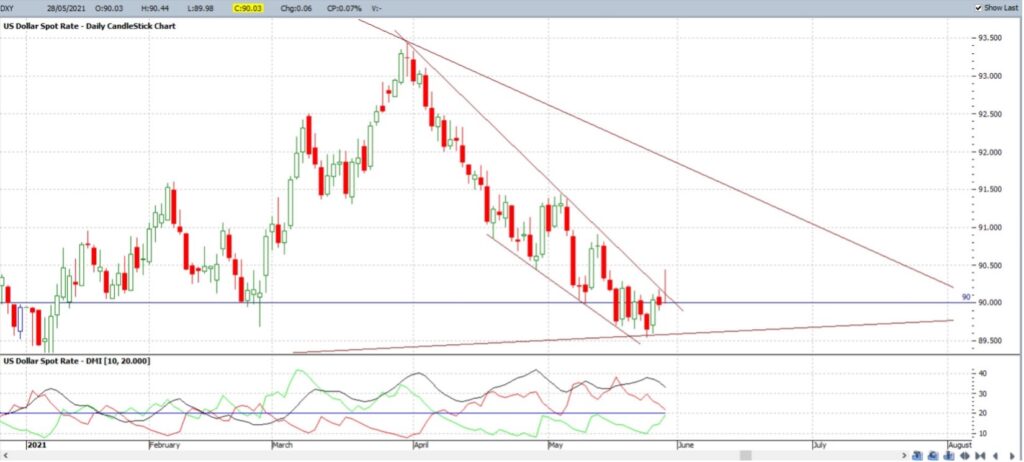
DXY daily: Drilling down to the daily chart though shows that bearish momentum is declining. Whilst still above the 20 threshold level, the –DMI is trending lower and towards 20 whereas bullish +DMI momentum (green line) is still below 20 but is trending upwards. The other feature worth noting on this daily time frame is the look of a bullish-reversal Descending Wedge. Friday’s daily candle breached the upper trend line of the wedge but could not manage to close above this resistance and note the indecisive Doji candle reflecting the uncertainty here.
DXY daily + Fibonacci: The upper descending wedge trend line will be worth monitoring for any new bullish breakout and Fibonacci retracement can be a useful tool to help identify potential bullish targets. The 61.8% Fibonacci is a popularly used target level in mean reversion moves and for the April- May swing low move of the descending wedge on the DXY this level comes in near the 92 level. Note, also, how this 92 level intersects near the weekly chart’s bear triangle trend line for some added confluence. Thus, any bullish wedge breakout would bring the 92 level into focus followed by the previous High, near 93.50, and, then, whole number levels on the way back to the 100 level.
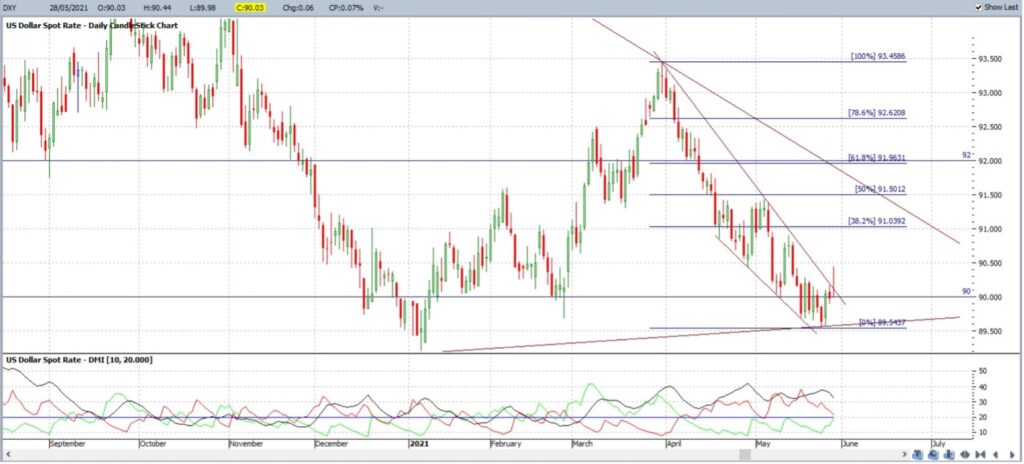
Putting it all together: Price action on the US$ index has been bearish for the last two months but bearish momentum is declining on the daily time frame as the index holds above the 90 support level. The DXY is currently trading within a bullish-reversal Descending Wedge on the daily time frame and this pattern is sitting within a larger triangle pattern on the weekly time frame. This price action is bringing a range of Support and Resistance levels to monitor and these are summarised below.
The Support levels to monitor on the DXY:
- 90 level.
- Weekly chart’s triangle support trend line.
- 80 level.
The Resistance levels to monitor on the DXY:
- The daily chart’s upper descending wedge trend line.
- 92: as the 61.8% Fibonacci retracement of the April-May Swing Low move.
- 93.50: as a recent High.
- 100 level.
- Weekly chart’s triangle resistance trend line.
About the Author:
Mary is a technical analyst and private trader based In Sydney, Australia and a member of the Australian Technical Analysts Association (ATAA). More information about her analysis and trading style can be found at Tradecharting.com.
Mary McNamara


