Oooh Look at Those Curves!

Oooh Look at Those Curves!
In association with DarwinexZero. Allocating real capital to successful traders 👇

Market peeps love talking about yield curves, steepeners and flatteners and pretending they’re real things. Most people don’t know this, but they’re fake. Totally made up…
It’s all a secret language originally devised by the ancient Illuminati cult of finance. Designed to keep you compliant and ignorant, pretending that these things are more complicated than they really are…
Today, we’ll decode those mysterious messages and prove that anyone can understand the language of bonds, despite the deliberate obfuscation of simple concepts by a nefarious cult of financial overlords.
Now, people might ask why this weird language even exists. Quick explainer.
Obfuscation is the obscuring of the intended meaning of communication by making the message difficult to understand, usually with confusing and ambiguous language.
The obfuscation might be either unintentional or intentional (although intent usually is connoted), and is accomplished with circumlocution (talking around the subject), the use of jargon (technical language of a profession), and the use of an argot (ingroup language) of limited communicative value to outsiders…
See? I’m only half joking about the cult.
Forget the cult, tell us about the yield curves
Right yeah sorry. What they are, and why they matter. It’s really simple. A yield curve is simply a visual representation of bond yields over different time horizons, or maturities.
Some examples to anchor understanding.
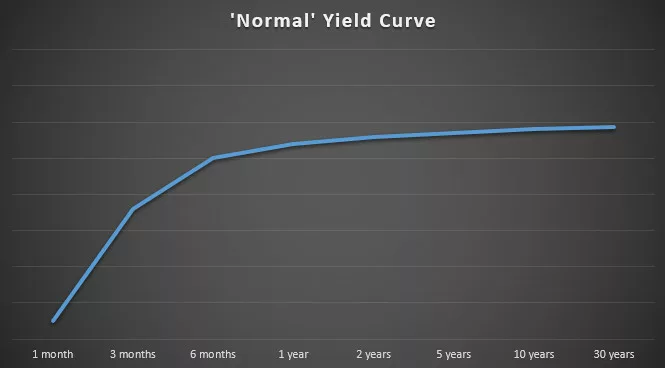
Here’s a ‘normal’ yield curve:

Essentially, the longer the duration of the bond, the more yield is on offer. A positively sloping curve is frequently referred to as a normal or healthy yield curve.
Why?
The theory goes that the longer the cash is tied up for, the better the return should be. The future is unknown, and a lot can happen in a decade.
In economic jargon, it’s called a term premium, the “excess yield that investors demand for holding a long-term bond instead of a series of shorter-term bonds”
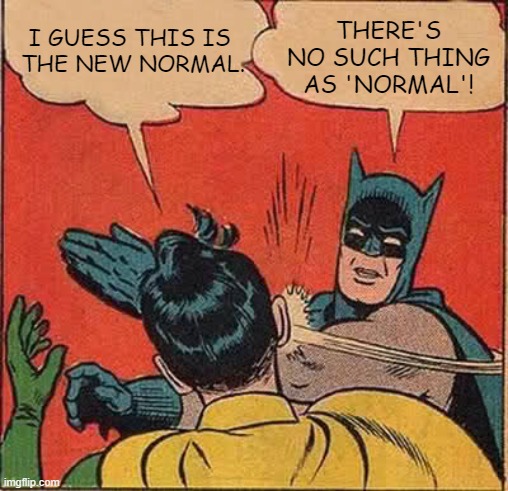
Quick note. I’ve called that curve shape ‘normal’ rather than normal for a very good reason.
Batman’s popped in to explain.

Thanks Batman. That’s absolutely right.
The world’s in a constant state of flux. The theoretical world is safe and fluffy, like a toy bunny. In the real world, Normal is the same as Average.
(The average person doesn’t exist. Which is why you’ve never met one)
Nevertheless, these curve shapes are useful. They can anchor our understanding of what’s happening. For example, the incentives for different participants to lend (or not), the attractiveness of an investment and so on.
Two more curve shapes…
The Pancake:

Totally flat yield curve. No term premium whatsoever. Lock your money up for a month, a year or three decades. The annual return is the same.
The Inverted:

Tough regime. Short term rates are higher than long term rates. Usually caused by central banks hiking the cash rate. Term premium is negative.
Which means that not only do you receive no added yield for lending over a longer time horizon, you get even LESS than you would for lending over the short term. Mechanically, this dis-incentivises lending.
Lucky for us, we’ve had all three curve shapes over the past three years. From positive, to flat, to inverted. Take a look at this superb illustration from James Eagle:
0:00
/1:001×
Video By James Eagle
Great, but what do those curve shapes mean?
And why should I care?
Well, there’s a saying that the bond market knows. As with most market ‘absolutes’ it’s complete bollo**s. They’re as good at predicting the future as anyone else.
The bond market is extremely important though. It basically sets the price of money in the wider economy.
If Fred walks into a bank and asks for a fixed rate 2 year mortgage, the bank will look him up and down like this…

Then say…
Fred, listen. You’re a valued customer, but you’re not as creditworthy as the government. We can lend them money, with a proper guarantee that it’ll be returned & they’ll pay us 5%.
We’ll lend to you. But we need to add a bit of risk premium to your rate, cover our backs, make sure we’re compensated for the additional risk you know?
6.4% sound good? Excellent. I’ll get the paperwork drawn up.
It won’t be said as blatantly as that in the real world obviously. It’ll be dressed up in soft sales language and jargon about benchmarks, base rates, premiums and so on.
Under the surface, though, the above example is basically what’s happening. The prices of money are set by the bond market. Central bank rate-setters stick their oar in every so often, and these prices are continuously ‘negotiated’ between rate setters and bond traders.
That impacts the cost of lending for everyone in the economy. Individuals, businesses, governments. Everyone.
So, it makes sense to pay attention when these yield curves start shifting…
Enter the jargon (again).
There’s basically four terms. Bull flattener, bear flattener, bull steepener, bear steepener.
Told you, it’s a cult.
All of these terms are used to describe different types of moves in the yield curve. Essentially, the changes in the difference (or spread) between short term yields & long term yields.
Steepeners
If the difference between short and long term yields is expected to widen, it’s called a steepener.
Flatteners
If the difference between short and long term yields is expected to narrow, it’s called a flattener.
All very simple so far. So why do we need the bull and bear terms?
These labels describe how the change will take place.
Take the Steepener as an example. We expect a wider spread between short and long term rates. How?
Will short term rates move most? Or stay sticky and let long term rates do all the work?
If short term rates don’t move while long end rates head higher, that’s the Bear Steepener.
If short term rates fall while long end rates don’t move, that’s the Bull Steepener.
In reality, it’s a bit messier. It’s more about which end of the curve moves more than the other.

For flatteners, we’re looking at a narrowing of the difference between the short and long term yields.
The Bear Flattener is when short term rates rise more than long term rates.
The Bull Flattener is when long term rates fall more than short term rates:

That’s it. Bond Cult demystified. You can now impress your friends, dates and in-laws with your knowledge.
Trader, Analyst and Strategist
20230803


