By doubting, we come to examine, and by examining, so we perceive the truth.~ Peter Abelard
In this week’s Dirty Dozen [CHART PACK] we look at seasonality, internals, financial breadth thrusts, weakening US labor data, and a bullish setup in corn, plus more…
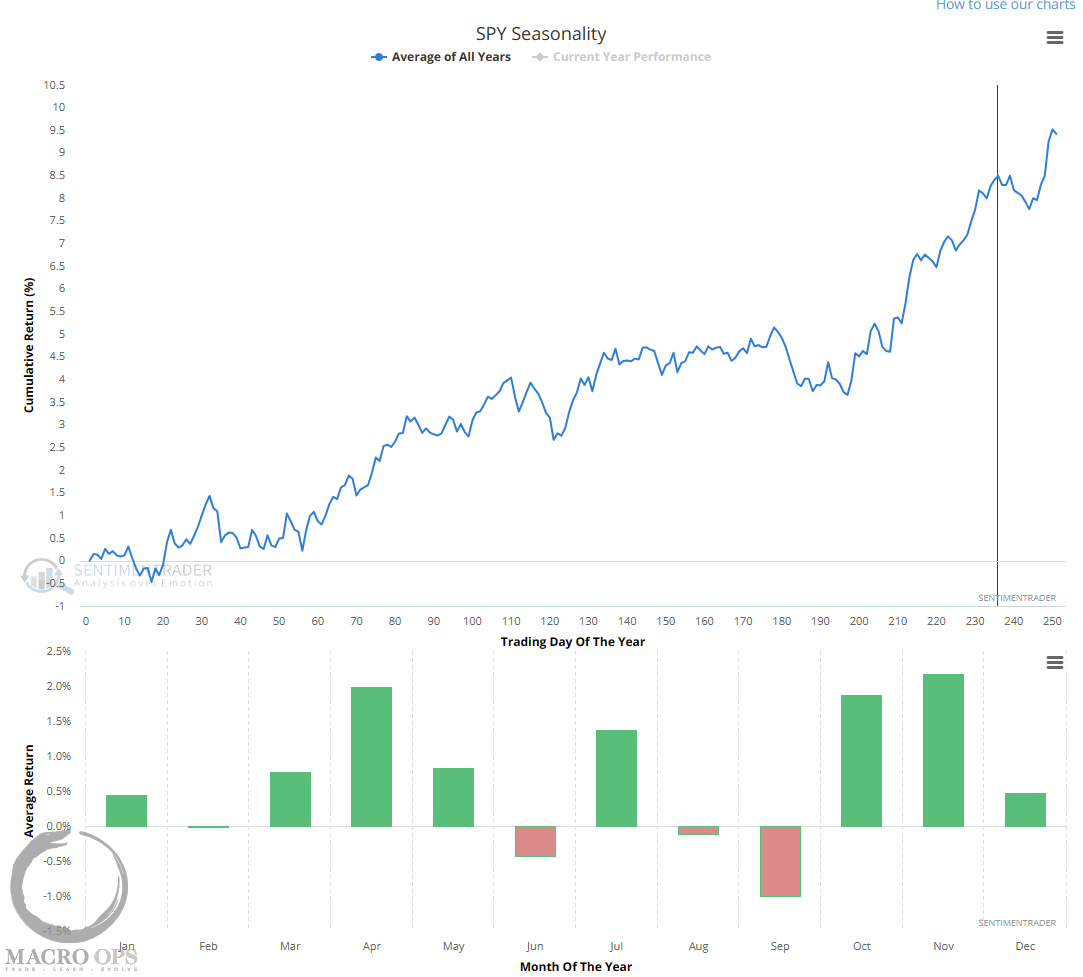
1. The SPX has a seasonal tendency to dip over the next eight trading days before a bottom followed by a runup into year’s end.
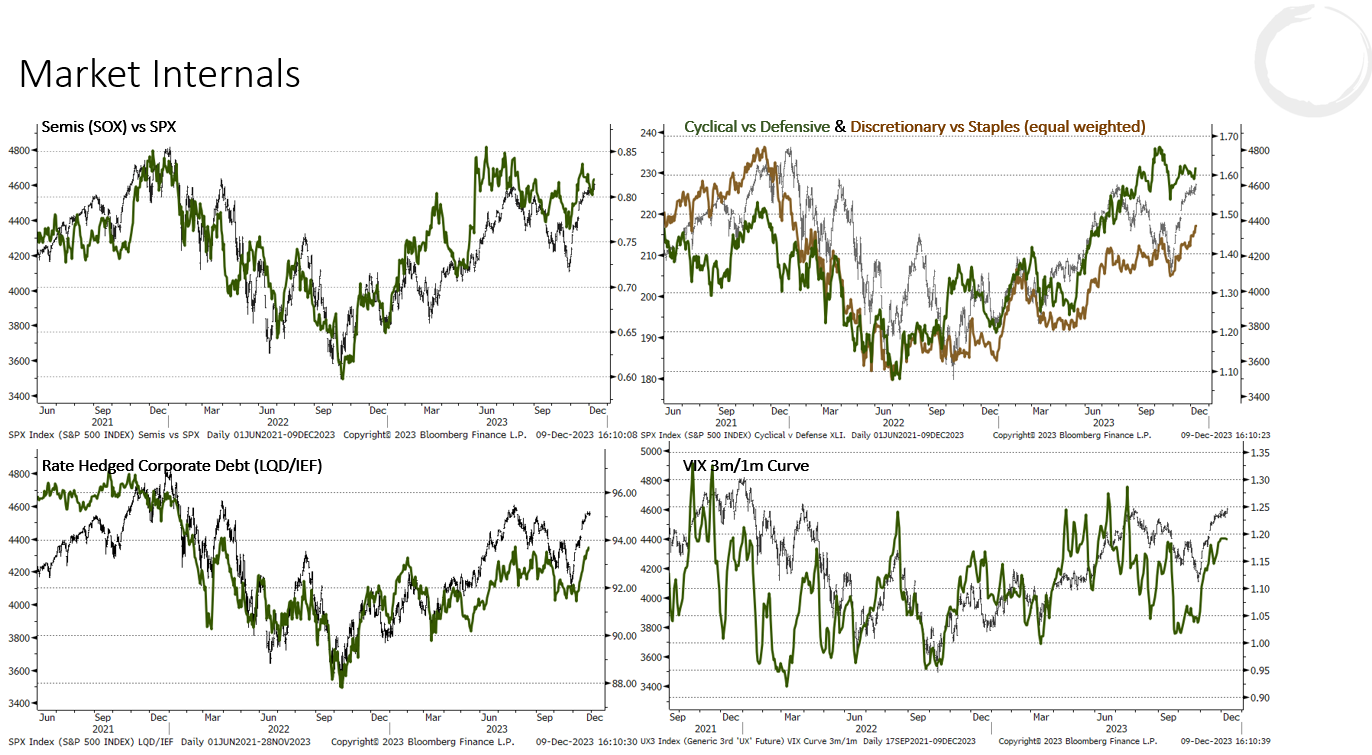
2. Sentiment and positioning are turning more bullish but aren’t at levels that typically mark larger pullbacks. Breadth is strong though nearing overextension and market internals remain supportive of the broader trend up.
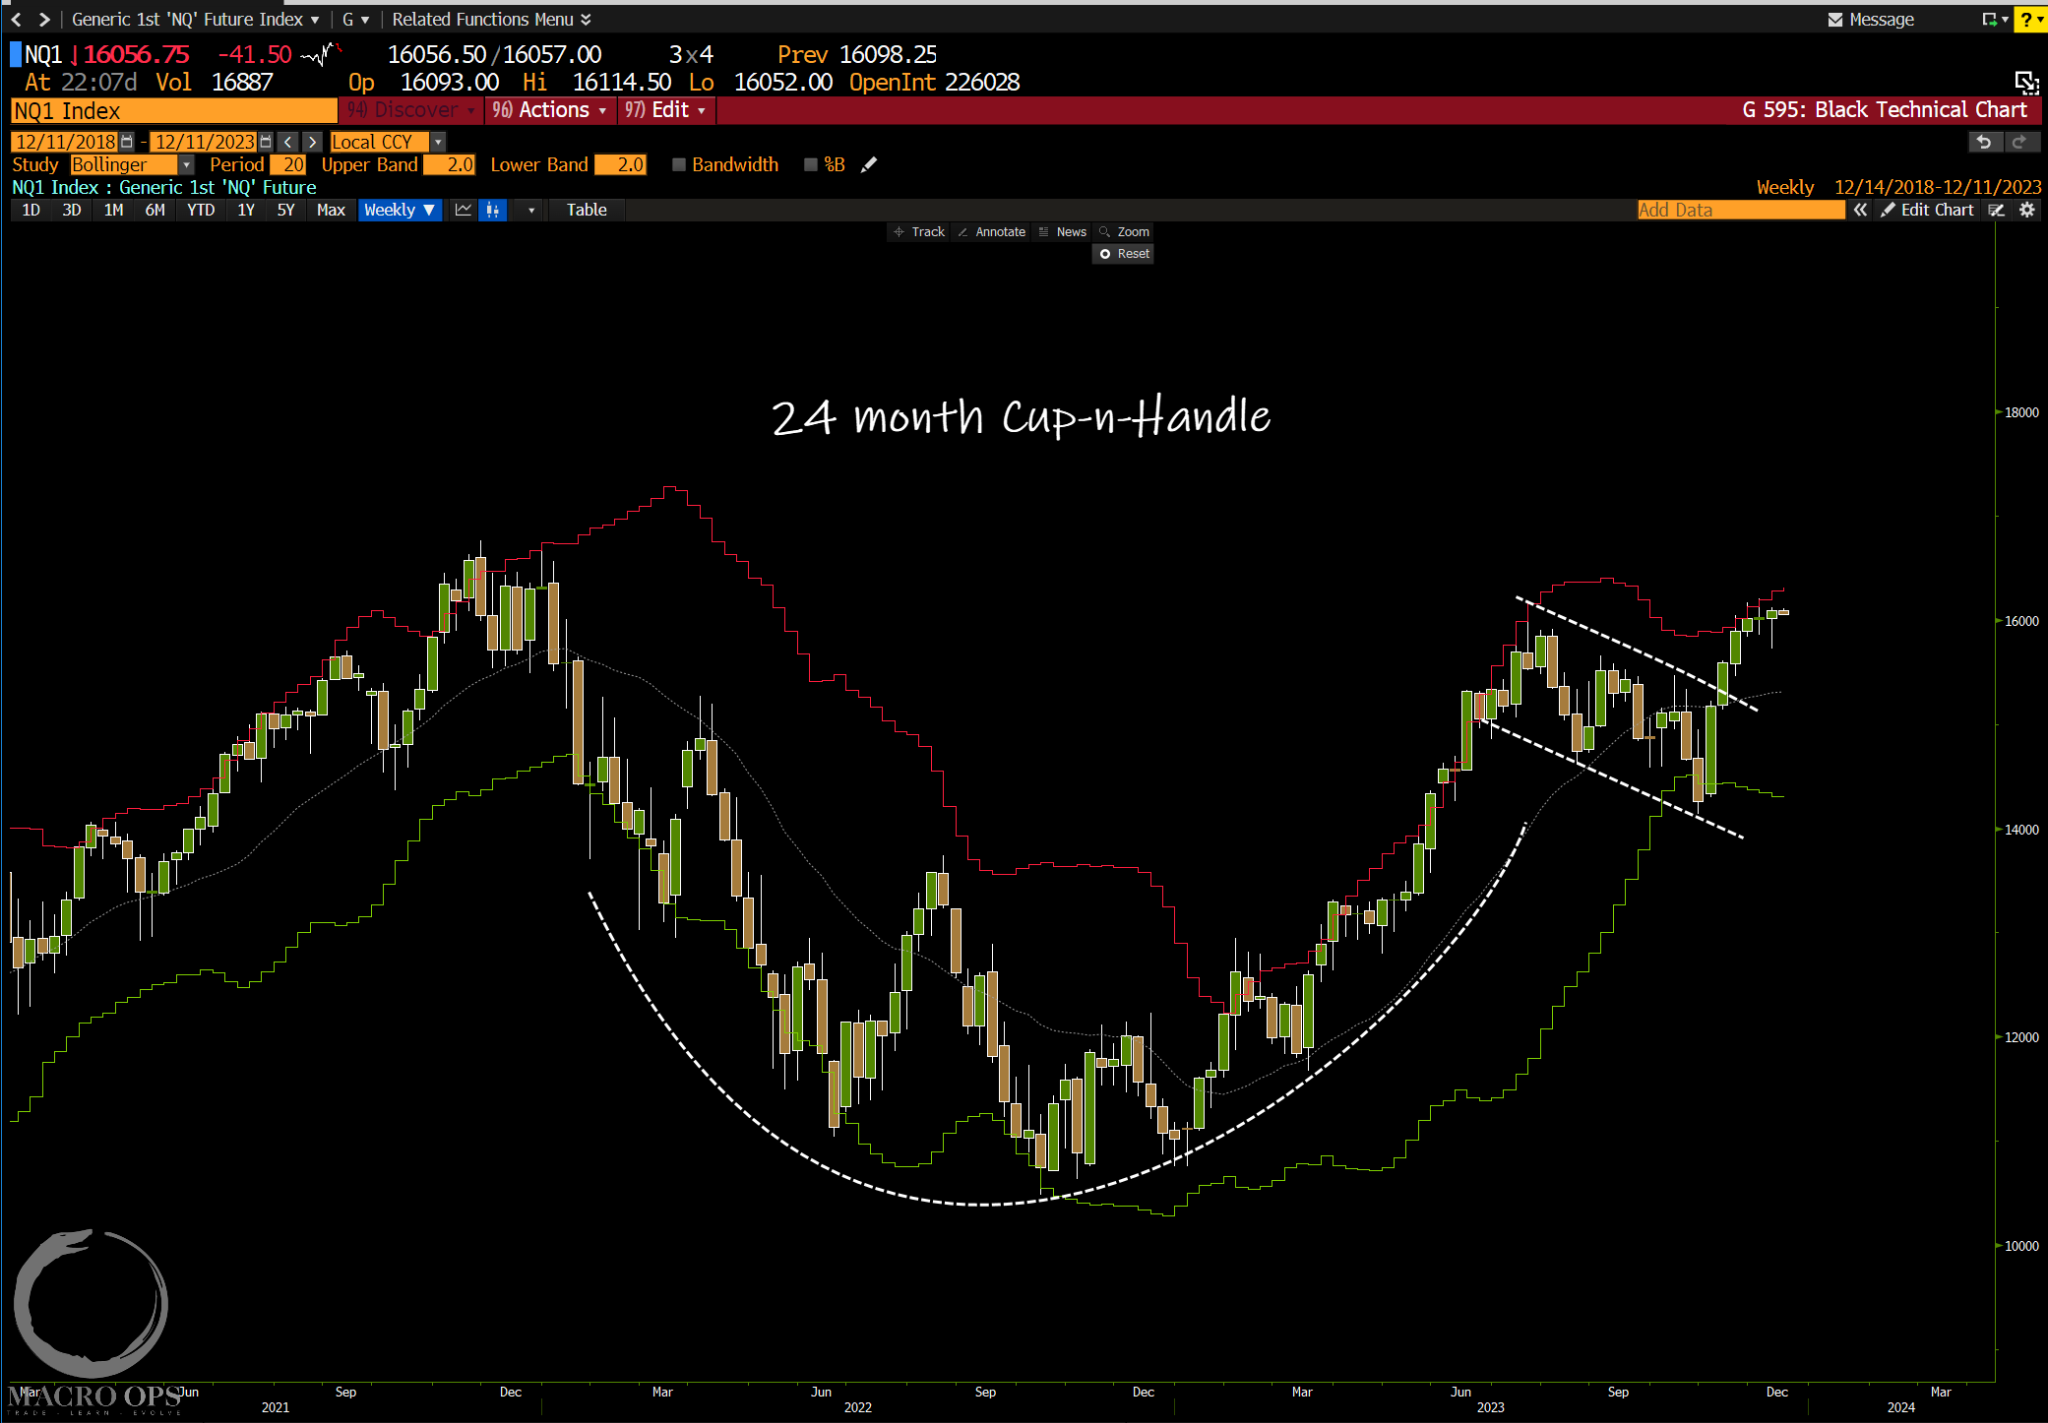
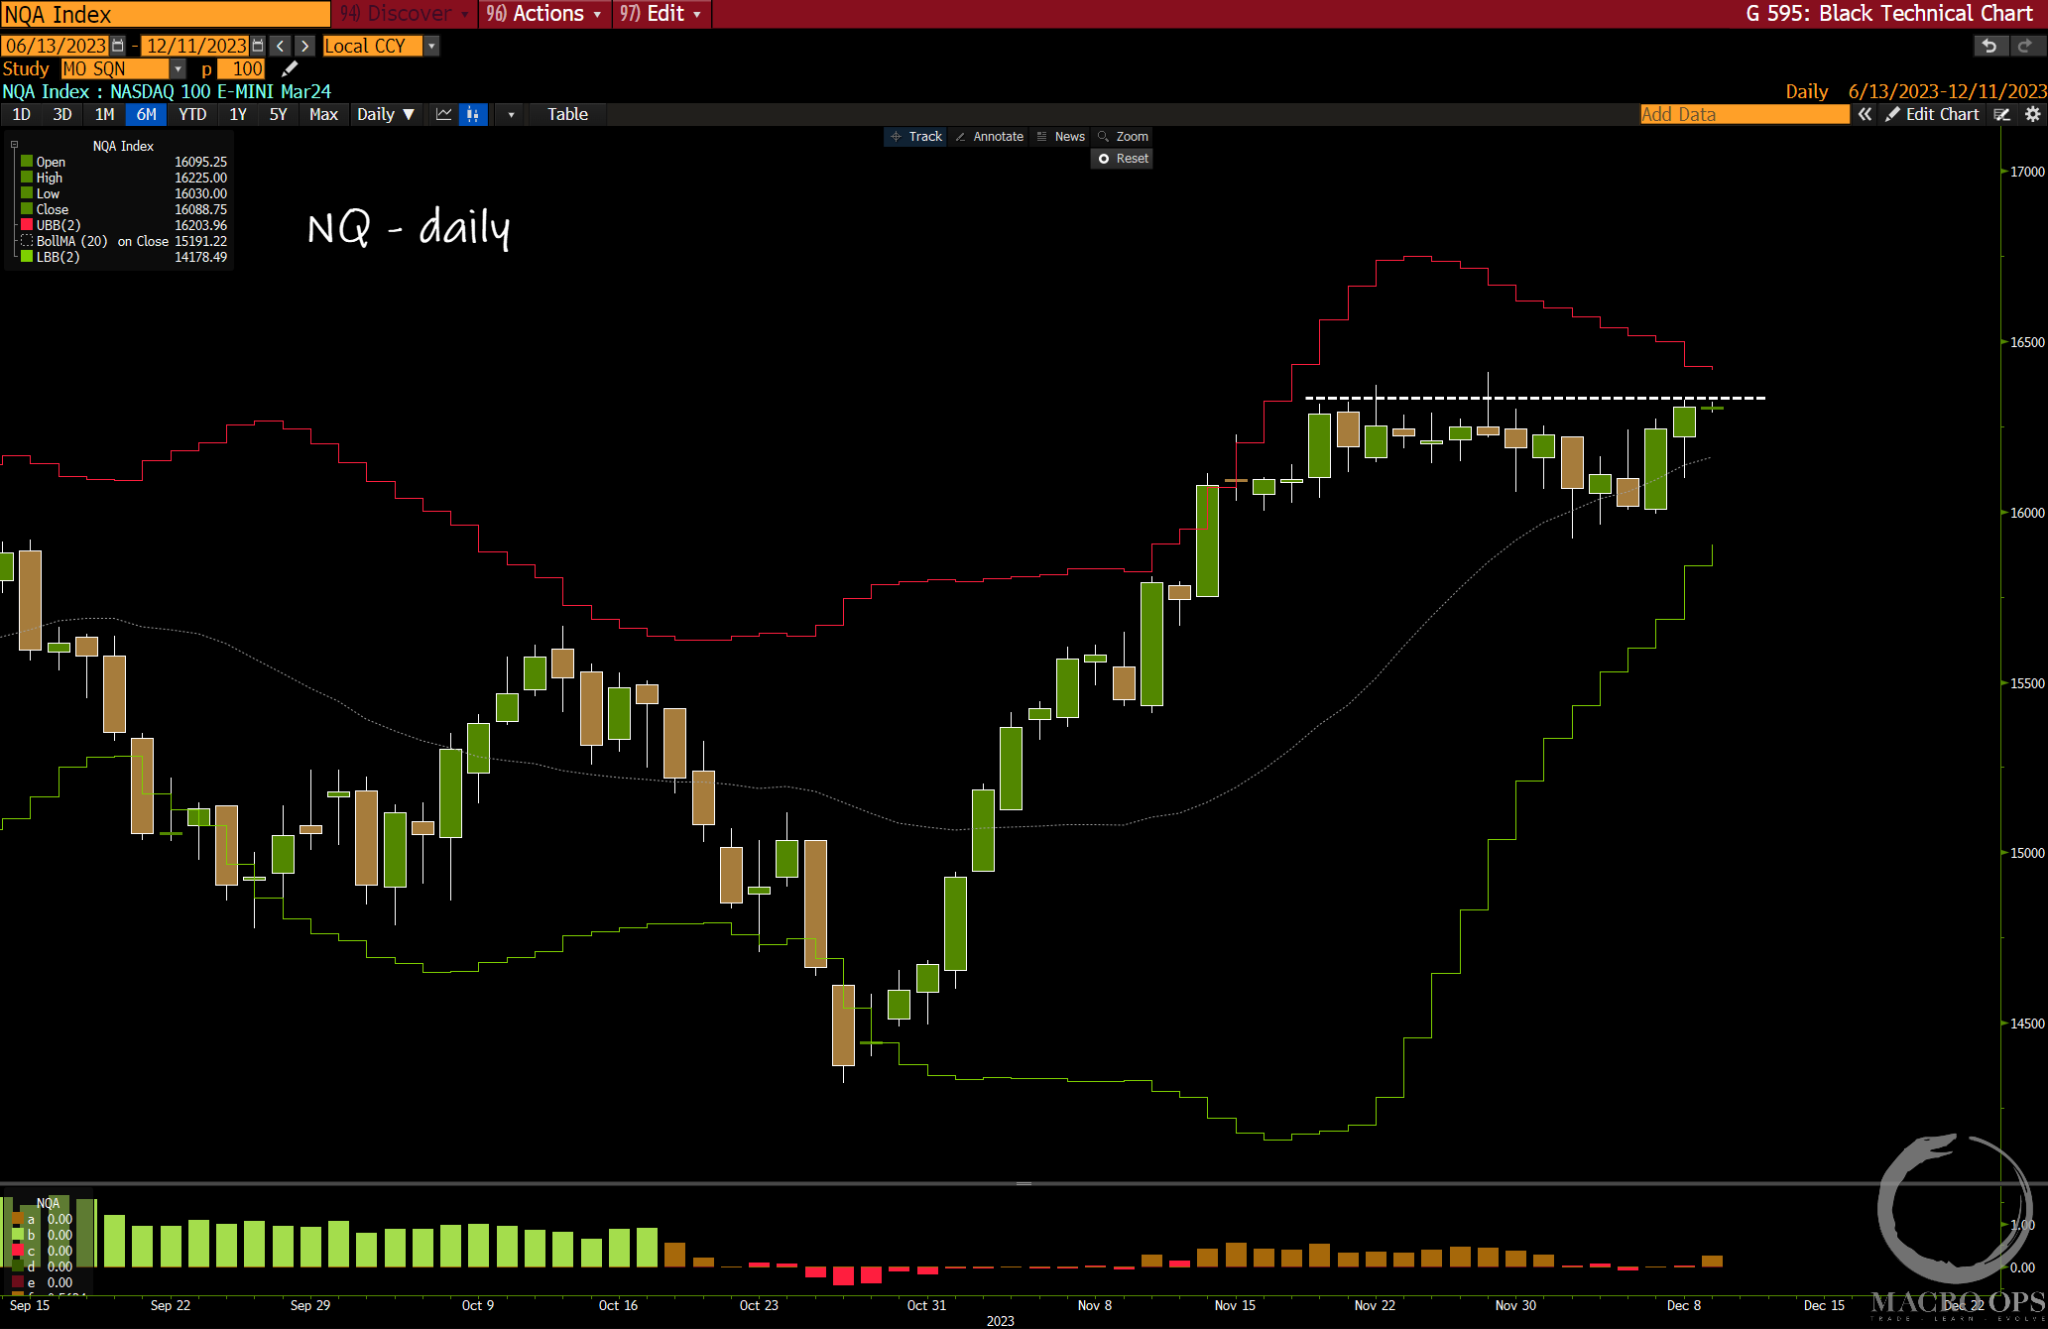
3. The Qs have completed a large 24-month cup-n-handle pattern. This is a bullish pattern.
4. We’re long and will be adding to our position on a daily close above its current sideways range.
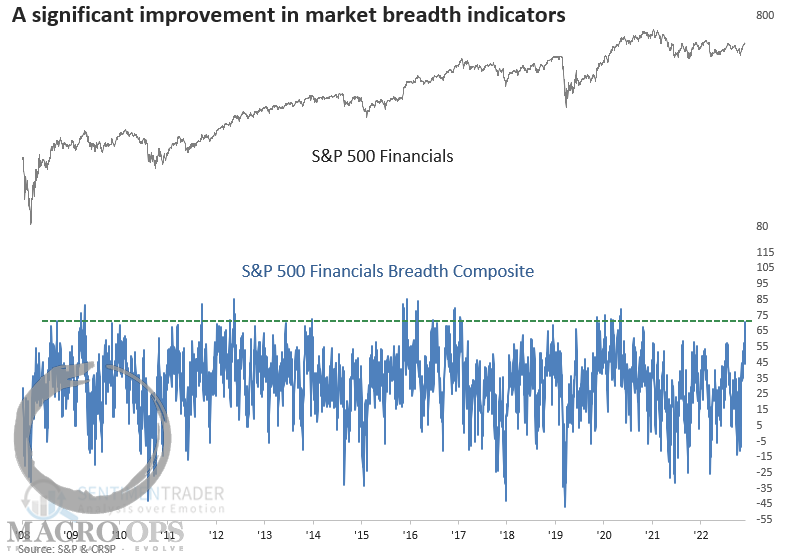
5. Last week the financial sector saw a surge in breadth. SentimenTrader writes “a breadth composite containing six indicators with various duration lengths exploded to the highest level in more than two years, triggering a buy signal for the group. The previous signal generated an alert in November 2020, leading to an almost 16% gain over the following three months.”
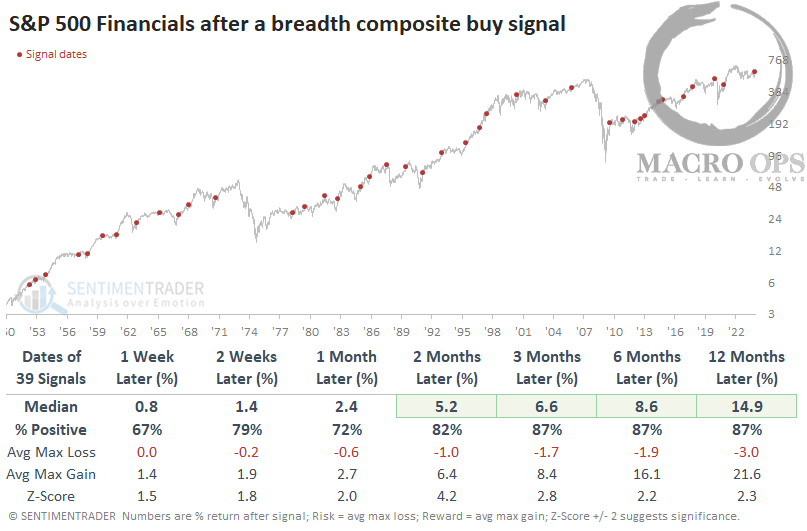
6. And “whenever the S&P 500 Financials breadth composite surges above 67%, returns, win rates, and z-scores for the financials sector are excellent across all time horizons. The signal showed a gain at some point over the subsequent three months in 38 out of 39 precedents.”
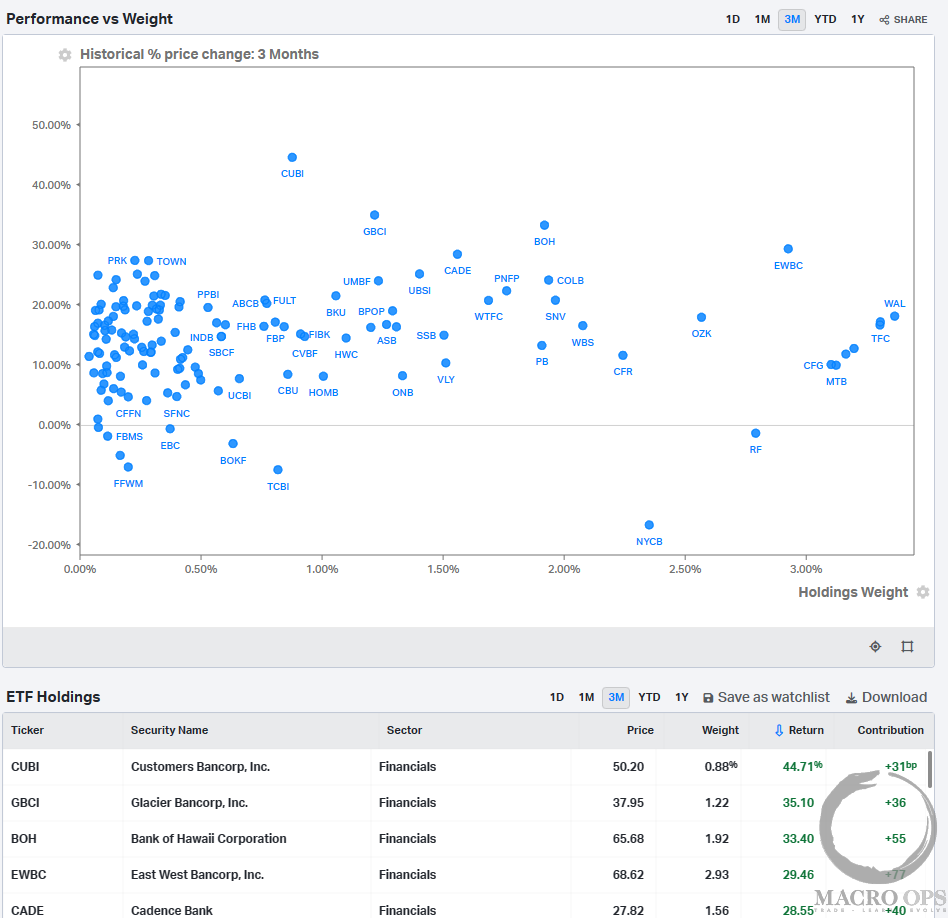
7. Here’s a snapshot of the 3m returns from the KRE Regional Banking Trust ETF (KRE) via the excellent analytics platform, Koyfin. CUBI, GBCI, BOH, EWBC, and CADE have the best 3m performance of the group.
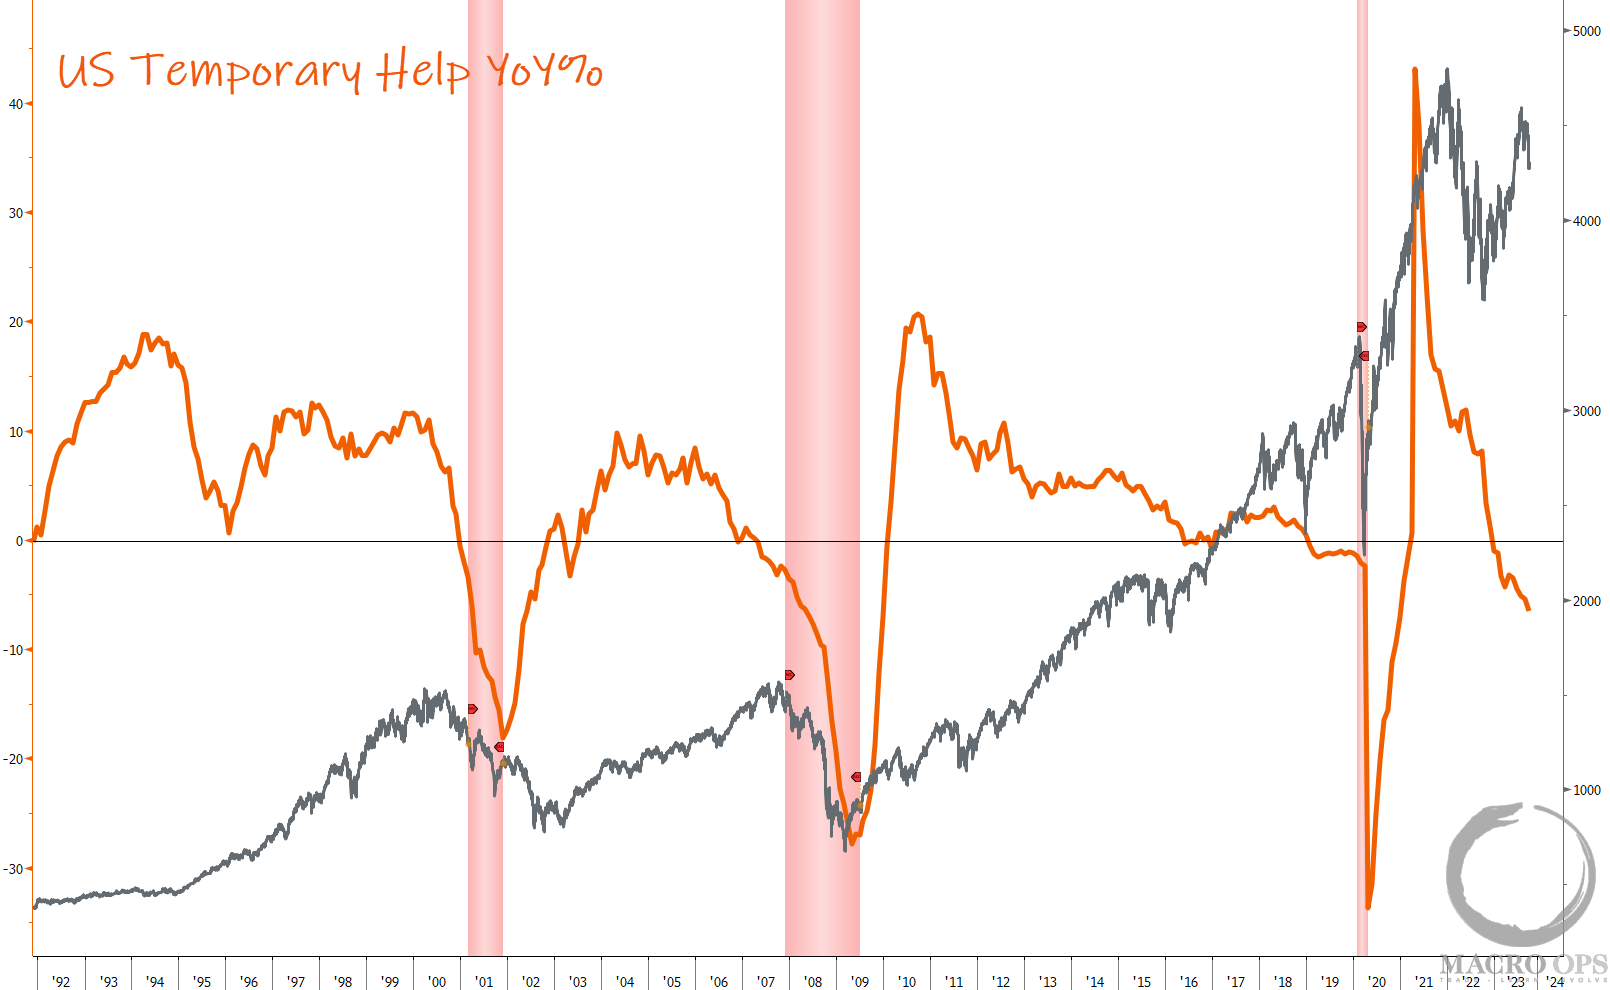
8. A favorite leading labor market indicator of mine is Temporary Help on a YoY basis. The US economy is certainly not in a recession at the moment, but this chart bears watching to see if keeps trending lower.
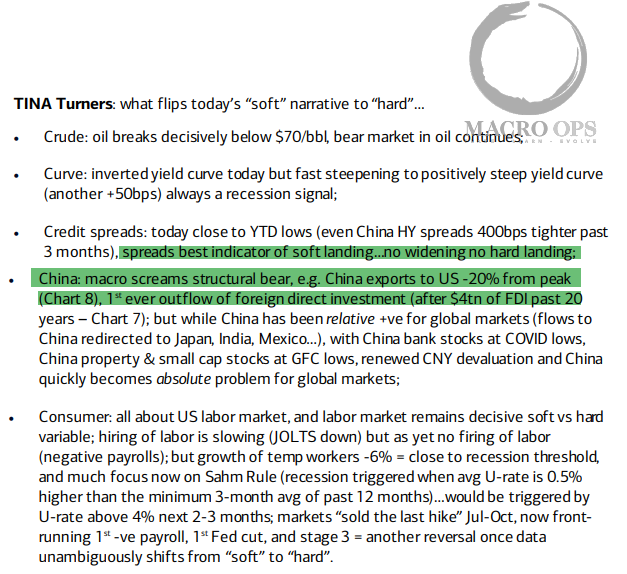
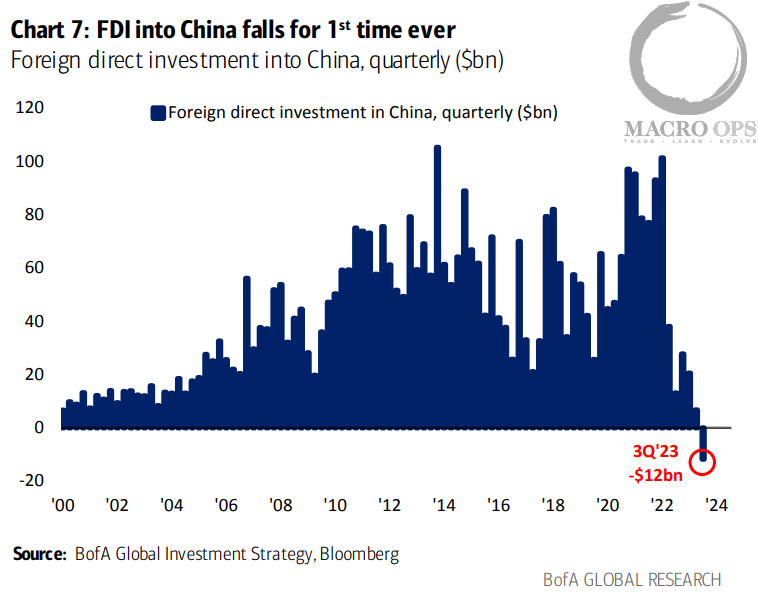
9. “What flips today’s ‘soft’ narrative to ‘hard”… via BofA.
10. China’s FDI has turned negative for the first time. Long USDCNH is giving us another setup with the pair reversing off its lower weekly Bollinger Band.
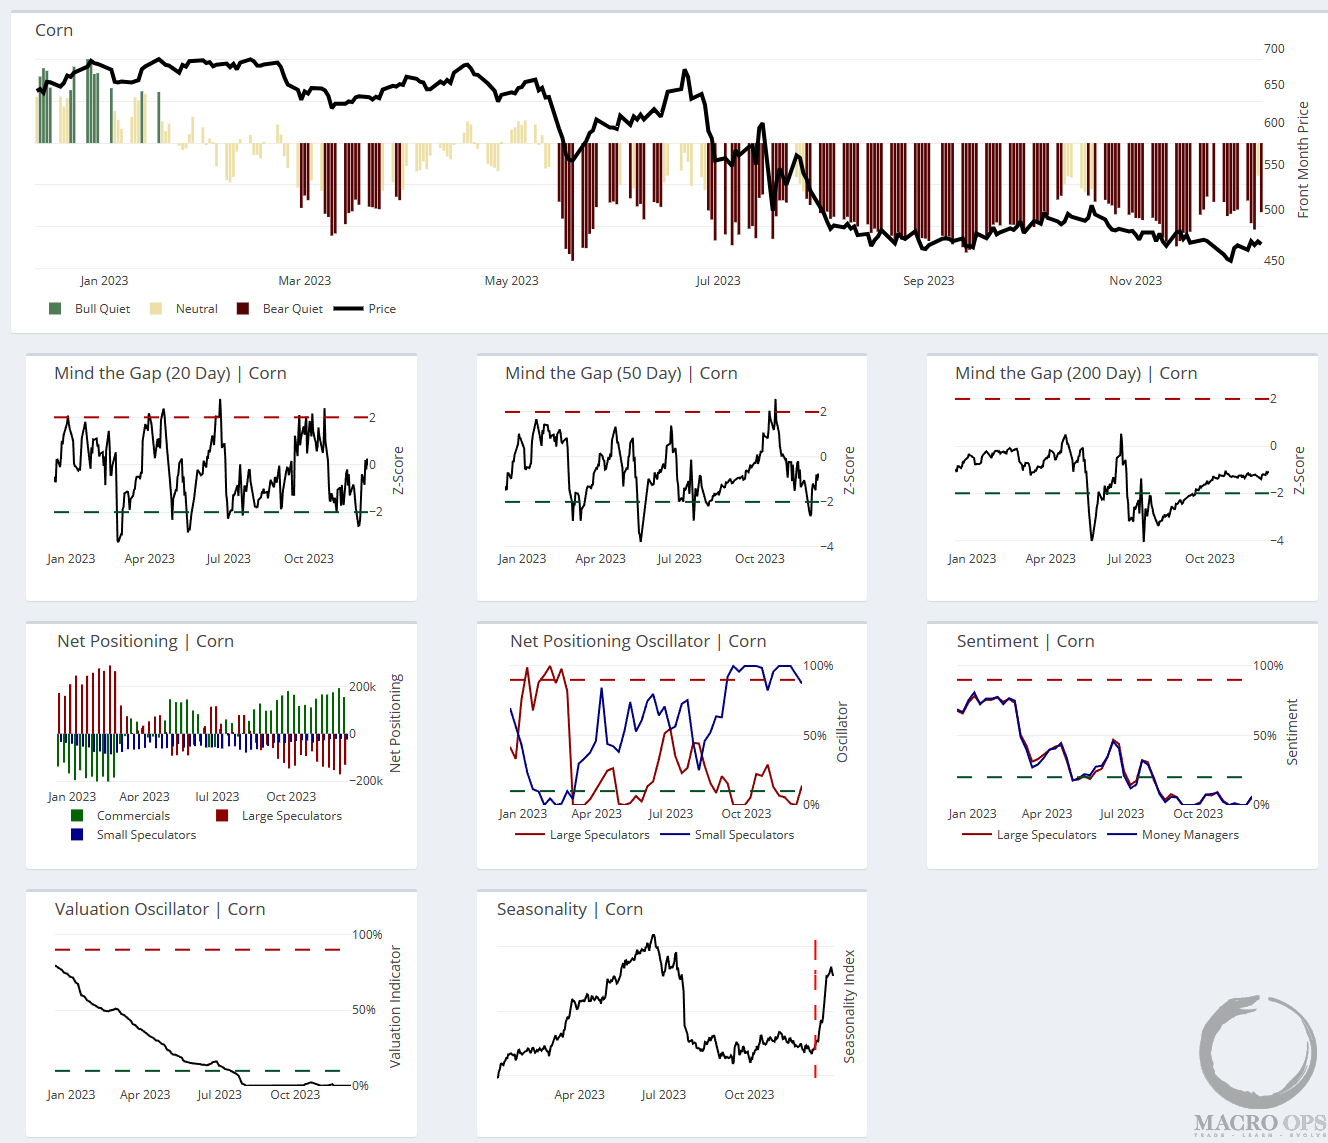
11. Corn recently hit over 2std oversold from its 20 and 50-day moving averages, and nearly 1.5std below its 200dma. Large and small specs are short. Our sentiment gauge is coming off the 0th percentile, as well as its valuation score. And it’s about to enter its strongest period of seasonality.
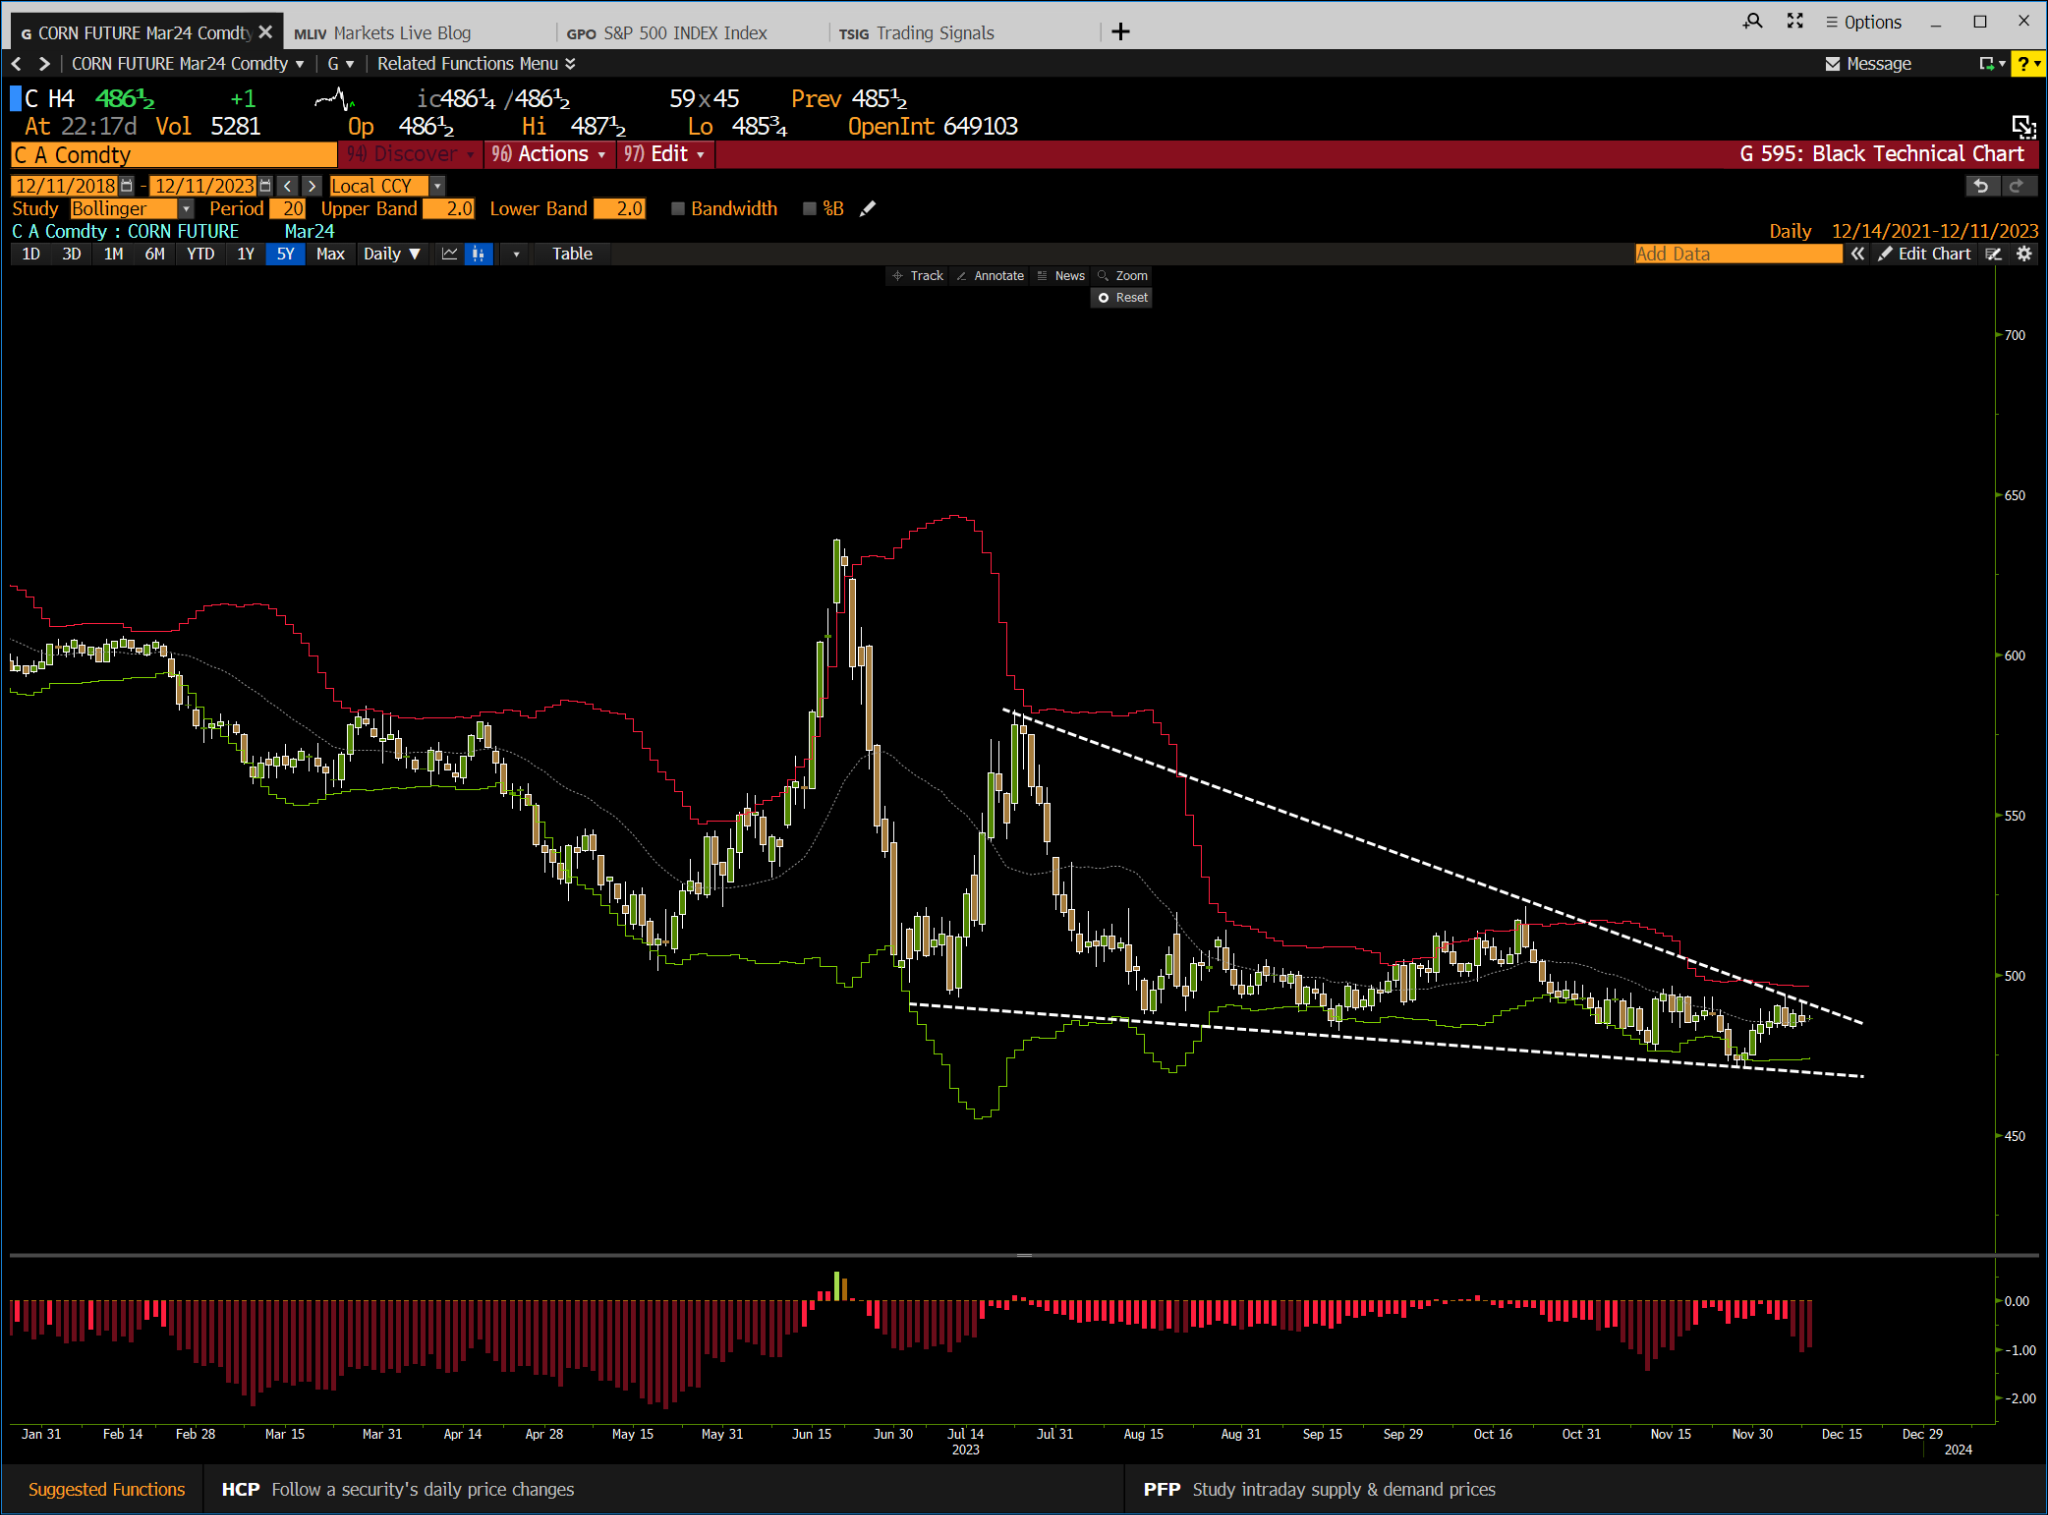
12. The chart has formed a nice falling wedge. We’ll look to get long on a confirmed breakout.
This website uses cookies to improve your experience. We'll assume you're ok with this, but you can opt-out if you wish. Cookie settingsACCEPT
Privacy & Cookies Policy
Privacy Overview
This website uses cookies to improve your experience while you navigate through the website. Out of these cookies, the cookies that are categorized as necessary are stored on your browser as they are essential for the working of basic functionalities of the website. We also use third-party cookies that help us analyze and understand how you use this website. These cookies will be stored in your browser only with your consent. You also have the option to opt-out of these cookies. But opting out of some of these cookies may have an effect on your browsing experience.
Necessary cookies are absolutely essential for the website to function properly. This category only includes cookies that ensures basic functionalities and security features of the website. These cookies do not store any personal information.
Any cookies that may not be particularly necessary for the website to function and is used specifically to collect user personal data via analytics, ads, other embedded contents are termed as non-necessary cookies. It is mandatory to procure user consent prior to running these cookies on your website.