Mish’s Daily: Volatility Taunting Fresh Equity Buyers


Mish’s Daily: Volatility Taunting Fresh Equity Buyers
Written by Michele ‘Mish’ Schneider
By Michele ‘Mish’ Schneider
This week I appeared with David Keller on Stockcharts Final Bar.
We discussed how the market is at a precipice.
And no doubt, the words I wrote on April 20th Daily “Now That “Stagflation” Has Gone Mainstream” some 5 months later are buzzing in my head:
My prediction-SPY QQQs DIA continue to rally-until IWM cannot clear $200-then everything sells off again.
That is precisely what happened.
Looking at the Volatility chart and our plug-ins which include 6-month calendar ranges, momentum, and leadership indicators, we can now ask…
Was that the sell off this past week, or are tougher times just getting started?
I do not use the “precipice” word lightly.
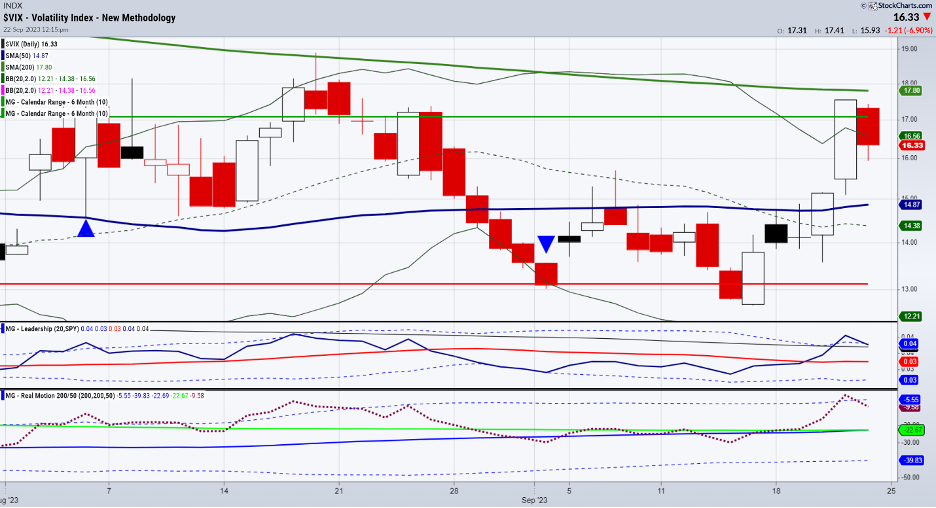
Cash VIX rallied right to the horizontal green line or July 6-month calendar range last Thursday, then backed off Friday but traded within the range of Thursday (inside day).
Note that the same type of move happened August 17, 18 and 21.
In fact, VIX took out the calendar range high and failed to hold above there once it was obvious that the 200-daily moving average above, another green line, could not clear.
Hence, the sell-off and rally in equities until September 15th when VIX broke but then quickly reversed above the July calendar range low (red line).
VIX is now outperforming the SPY.
And momentum in our Real Motion indicator shows us that there is a mean reversion sell signal in VIX ending this week.
Precipice?
Now we must ask ourselves as September ends, whether the market can bounce back leaving VIX in the dust.
“The last 9 times the S&P was lower in both August and September saw Q4 close higher (back to 1981). Higher 9 for 9 and up 9.1% on average.” Ryan Detrick.
Can we make it 10 for 10?
Let’s ask Granddad Russell 2000 and Granny Retail.
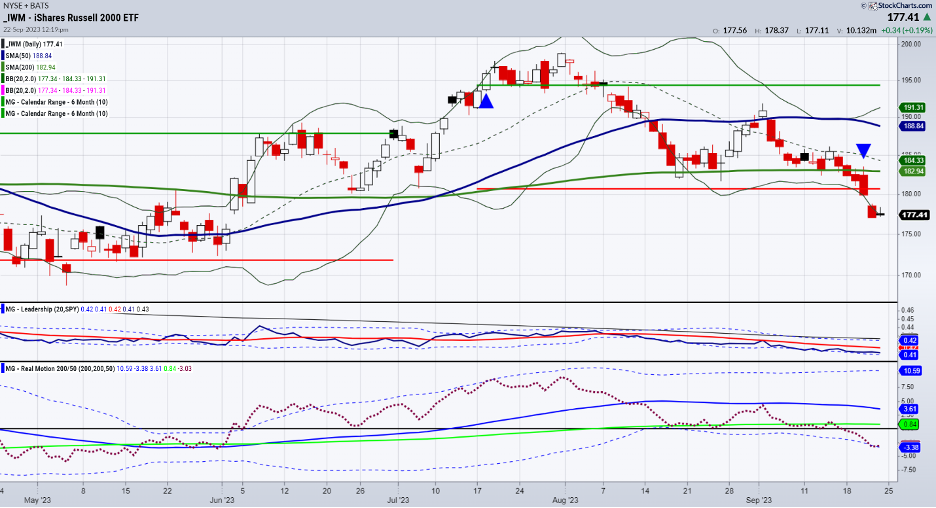
The Russell 2000 (IWM) trades below everything: the July calendar range low, the moving averages, the SPY, and sits on the Bollinger Band in real motion momentum. IWM sits there as in mean reversion or more weakness coming?
The best we can say is that IWM is holding above May and June lows. It also has not filled the gap it left when it gaped higher on June 2nd.
However, note the January 6-month calendar range low held up in June. Not so much right now.
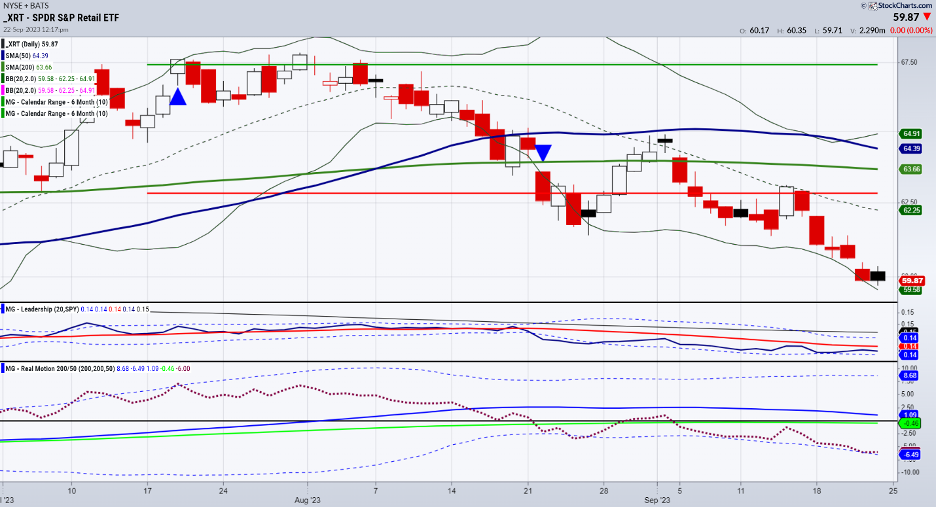
Then there is Granny Retail (XRT).
We have written a lot about this sector’s underperformance.
Now, similarly to IWM, XRT trades below everything: the July calendar range low, the moving averages, the SPY, and sits on the Bollinger Band in real motion momentum. XRT sits there as in mean reversion or more weakness coming?
Nonetheless, Granny is weaker than Gramps. The gap that IWM is holding from its gap up June 2nd, has been filled this past Thursday and Friday in XRT.
Bottom line:
A move over 18.00 or the 200-DMA in VIX, coupled with more downside pressure in IWM and XRT (watch momentum), could spell another leg lower-perhaps to 170 in IWM and 57 in XRT.
Then, we look at the monthly charts and our 80-month moving averages on both, which have held since the heart of COVID.
And, to Ryan Detricks’ point, should we see that mean reversion in XRT and IWM, plus watch VIX to fail 15.00-16.00, then we could get a bounce at least, if not more.
Precipice: a very steep side of a cliff or a mountain. Parachute anyone?
If you find it difficult to execute the MarketGauge strategies or would like to explore how we can do it for you, please email Ben Scheibe at Benny@MGAMLLC.com, our Head of Institutional Sales. Cell 612-518-2482
For more detailed trading information about our blended models, tools, and trader education courses, contact Rob Quinn, our Chief Strategy Consultant, to learn more.

You don’t want to miss Mish’s 2023 Market Outlook E-available now

NOT TOO LATE Click here if you’d like a complimentary copy of Mish’s 2023 Market Outlook E-Book in your inbox.

Get your copy of “Plant Your Money Tree: A Guide to Growing Your Wealth”
Grow Your Wealth Today and Plant Your Money Tree!

“I grew my money tree and so can you!”- Mish Schneider
Mish in the Media
Benzinga Pre Mkt 09-22-23
Final Bar with Dave Keller 09-21-23
Your Daily Five Stockcharts 09-20-23
Article-Q4 Stock Market Outlook 09-20-23
Article-Kitco Oil 09-20-23
CMC Market Daytrading Commodities Ahead of the FOMC 09-20-23
Business First AM COIN 09-19-23
Yahoo Finance Chart Analysis 09-19-23
CMC markets Daytrading Commodities 09-19-23
Business First AM TEVA 09-14-23
IBD Investing 09-13-23
Traders Edge Jim Iuorio Bob Iaccino 09-13-23
Coming Up:
September 29 Live Coaching
October 2 Schwab The Watch List
October 4 Jim Puplava Financial Sense
October 5 Yahoo Finance
October 12 Dale Pinkert F.A.C.E.
October 26 Schwab at the NYSE
October 27 Live in Studio with Charles Payne Fox
October 29-31 The Money Show
Weekly: Business First AM, CMC Markets
ETF Summary
S&P 500 (SPY) 440 now pivotal 430 support
Russell 2000 (IWM) 180 now pivotal 170 huge
Dow (DIA) 347 pivotal 340 support
Nasdaq (QQQ) 363 now key pivotal resistance
Regional banks (KRE) 39.80 the July calendar range low
Semiconductors (SMH) 133 the 200 DMA with 147 pivotal resistance
Transportation (IYT) Landed right on the 200-DMA which now must hold
Biotechnology (IBB) Broke 124 so now watching 120
Retail (XRT) 57 key support
20230924