Blake Morrow’s Chart of The Day – Gold

Gold
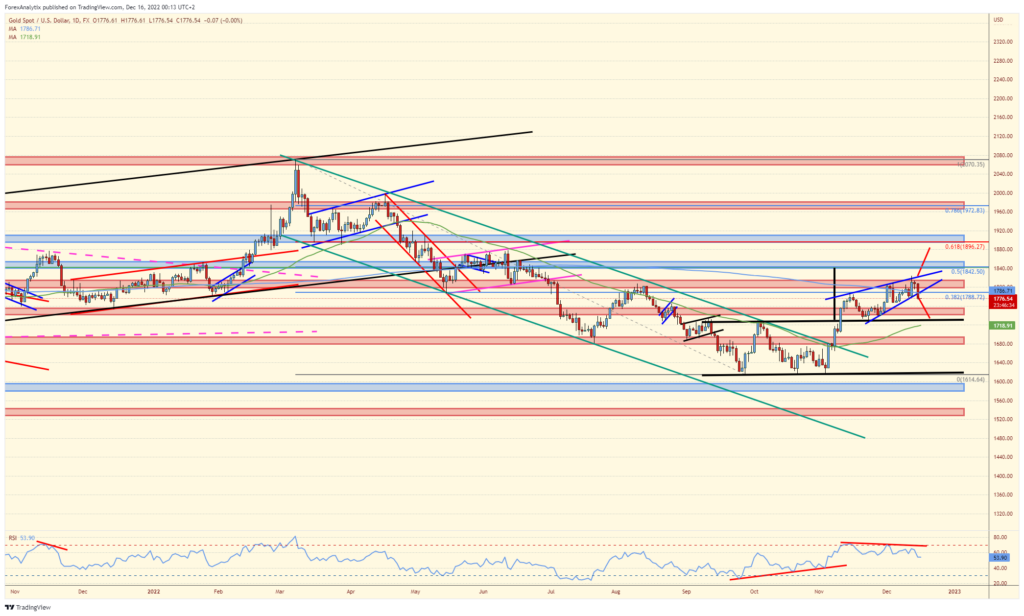
Following the FED, gold initially stalled and then turned lower from the ascending wedge’s T/L resistance and is about to break down from here.
Today we closed the day below the wedge and the 200DMA and this points to a reversal and pullback to the breakout area at $1730. Keep looking lower for now as long as we keep trading below $1805.

If you want to learn more about the Trader Funding Program and join an elite group of traders at Forex Analytix, click here to learn more. Trade our money, take 75% of the gains and none of the risk.
Steve Voulgaridis / Blake Morrow
20221216


