Technical Analysis – DayTradeIdeas

Daily Technical Analysis is provided by Jason Sen of Day Trade Ideas, who has been day trading since the late 1980’s. Jason has been a contributor of Traders Summit since the beginning. He primarily focuses on providing technical analysis of the financial markets, including stock chart patterns, Forex and Metals setups, and other useful technical analysis.
Gold held 1 point above first support at 1782/80 – If you did manage to buy in time, Gold shot higher to my targets of 1797/99, 1807/09 & even as far as 1822/24 for a huge 40 point profit on the day.
Silver has strong support again at 2270/50. Outlook remains positive.
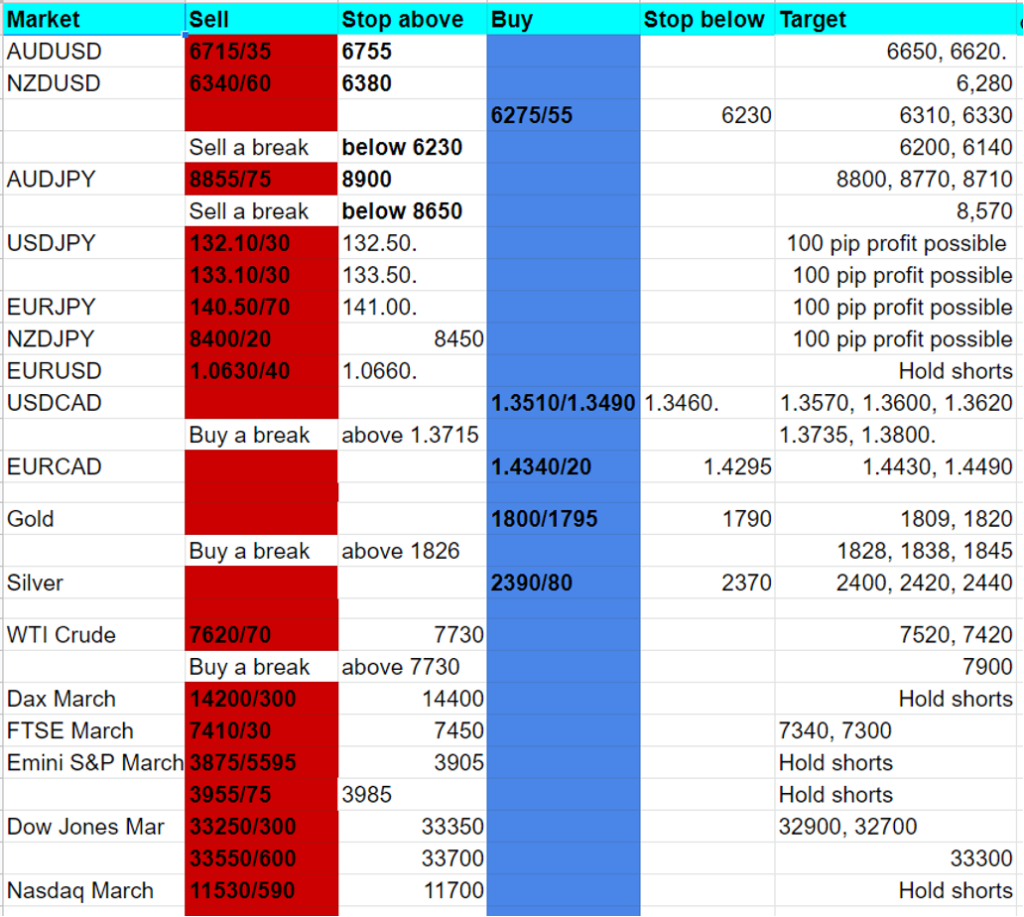
WTI Crude February resistance at 7620/70. Shorts need stops above 7730. A break higher is a buy signal.
Update daily by 05:00 GMT.
Today’s Analysis.
Gold retest last week’s high at 1822/24 as predicted this week. Obviously this is key to direction today with a high for the day exactly here yesterday. Be ready to buy a break above 1826 targeting 1828/30 & 1839/41, perhaps as far as 1846/47.
Failure to beat 1822/24 leaves a potential double top which would be negative in the short term & risks a slide to 1810/09. I still think the downside is likely to be limited but below here can target look for a test of support at 1800/1795. Longs need stops below 1790.
Silver longs at support at 2270/50 worked perfectly this week as we beat 2330/35 to target 2360/65 & 2390/2400, exactly as predicted!! Holding above 2415 keeps the outlook positive targeting 2440 & 2465, perhaps as far as 2490/2500.
The downside is expected to be limited with support at 2390/80. Longs need stops below 2370.
WTI Crude February tests resistance at 7620/70 with a high for the day exactly here. Shorts need stops above 7730. A break higher is a buy signal targeting 7760/80 then 7900/20.
Targets for shorts are 7520, 7420
Stock markets
Emini S&P March hit my 3810/00 target with a low for the day exactly here.
Nasdaq March lower as predicted to my next target of 11100/11000 with a low for the day exactly here.
Emini Dow Jones March collapsed as expected after the sell signal, hitting my target of 32850/750, with a low for the day just a little below at 32686.
Remember when support is broken it usually acts as resistance & vice-versa.
Update daily by 06:00 GMT.
Today’s Analysis.
Emini S&P March collapsed as predicted to my 3810/00 target with a low for the day exactly here.
Again, gains are likely to be limited with strong resistance at 3875/95. Shorts need stops above 3905. A break higher however can target strong resistance at 3955/75. Shorts need stops above 3985.
A break below 3795 can target 3780 & 3740/35.
Nasdaq March made a low for the day exactly at my next target of 11100/11000. Gains are likely to be limited with strong resistance at 11300/350. Strong resistance at 11530/590. Shorts need stops above 11700.
Minor support at 11100/11000 but a break lower eventually can target 10850/750.
Emini Dow Jones collapsed again as predicted to my target of 32850/750. I was wrong about longs being risky! We have bounced to strong resistance at 33250/33300. Shorts need stops above 33350. Strong resistance at 33550/600. Shorts need stops above 700. Shorts at 33250/33300 can target 33050 & 33950/900. Further losses retest 32700/680. A break lower targets 32500/450 then 32100/32000.

Jason Sen, Director
https://www.daytradeideas.co.uk
20221221


