S&P500 Update

S&P500 Update
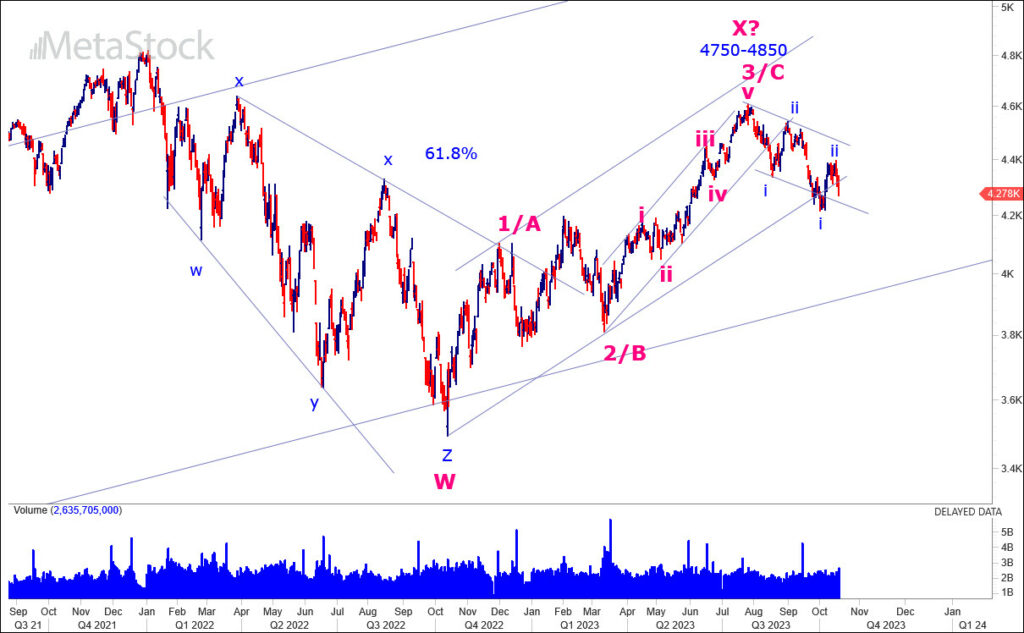
I had this chart in the Long Short report months ago with both alternates, never deleted it from my saved counts just in case. The first time we broke the rising channel I was hopeful it was just wave 2/4 down because of the PCR ratios being elevated, but now it is breaking again and that puts us at major risk of something going wrong. Till we can say for sure that this is not the case it is better to be careful especially where midcap small-caps are concerned or PSU stocks that have run up a lot. If the US gives us a knee-jerk reaction we should not get caught napping.

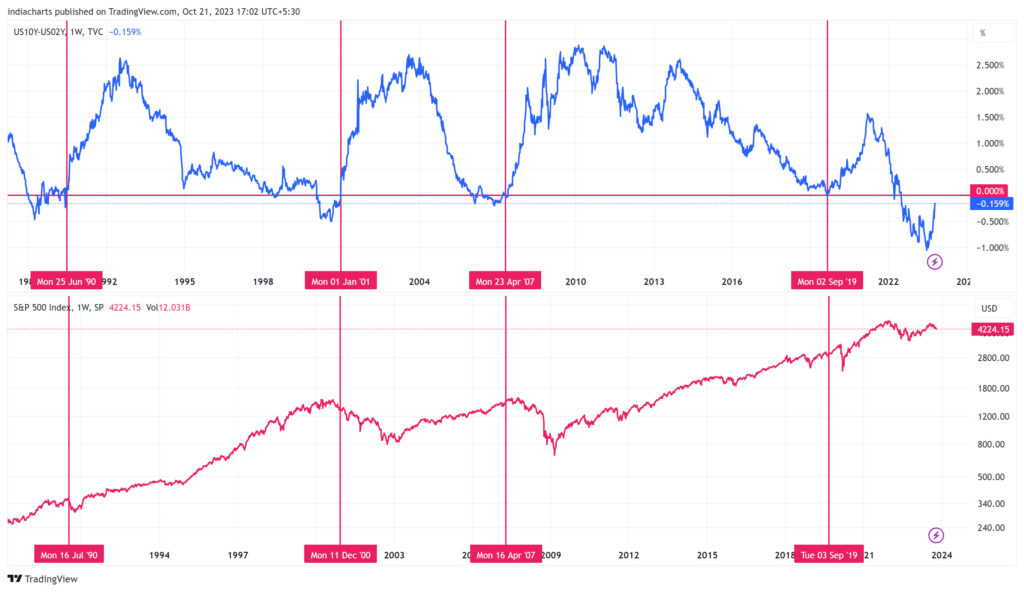
On the other hand, the US yield curve has started to steepen again and that is usually the tipping point for the stock market. It starts to recognize an economic slowdown that can now result in a recession. The stock market is often ahead of the curve so it will have discounted the recession before the authorities announce it as official. The breakdown in the chart above combined with this is not a good setup for stocks for the coming months. The red vertical lines on the chart show what happened when the yield curve went back above zero on previous occasions.

20231024


