Navigating Volatility: US Stock Markets at a Crossroads – Technical Analysis DayTradeIdeas


Navigating Volatility: US Stock Markets at a Crossroads – Technical Analysis DayTradeIdeas
Daily Technical Analysis is provided by Jason Sen of Day Trade Ideas, who has been day trading since the late 1980’s. Jason has been a contributor of Traders Summit since the beginning. He primarily focuses on providing technical analysis of the financial markets, including stock chart patterns, Forex and Metals setups, and other useful technical analysis.
Join Telegram https://t.me/daytradeideas
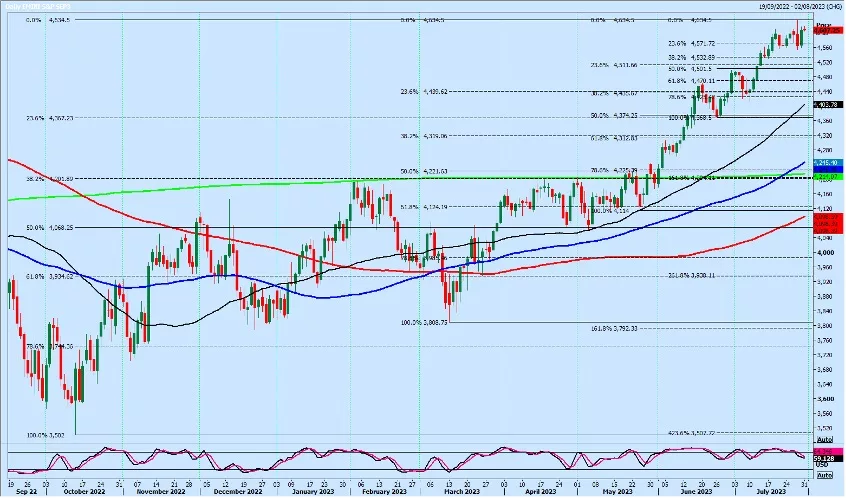
Emini S&P September shot higher to recover much of Thursday’s bearish engulfing candle & steep losses to reach Tuesday & Wednesday’s highs. Further gains test last week’s high at 4634
Support at 4570/60. A break below 4555 should be a sell signal to target 4535 & 4510/4500.
A break above 4640 can target 4670/75, perhaps as far as 4695/99.
Nasdaq September has traded sideways for 2 weeks in a range from 15522/483 up to 16062. A break below 15470 is a sell signal for today targeting 15300/250.A break above the July recovery high at 16040/16060 can target 16300/350.
Emini Dow Jones September staged a recovery after Thursday’s negative action. The question now is whether we break above Thursday’s high at 35483 or Thursday’s low at 35346.
A break above 35500 can target 35850/900.
A break below support at 35400/350 is a sell signal targeting 35100/050.
Please email me if you need this report updated or Whatsapp: +66971910019 – To subscribe to this report please visit daytradeideas.co.uk or email jason@daytradeideas.co.uk
Jason Sen, Director
https://www.daytradeideas.co.uk
20230731