Macro Tides – “Higher Treasury Yields Likely”

In an earlier post entitled ‘Treasury Yields Breakout’ on February 17, I discussed why Treasury yields were headed higher. “The 61.8% retracement of the decline in the 30-year Treasury yield from its high of 3.455% in November 2018 to 0.837% in March 2020 would target 2.455%. This is just above where the 30-year traded in the fourth quarter of 2019.” On February 17 the 30-year Treasury yield closed at 2.069% but jumped to an intraday high 2.402% on February 25. Although the 3-year Treasury yield has dipped from 2.402% to 2.216% on March 2, there is a strong likelihood that the 30-year Treasury yield will exceed the February 25 high of 2.402% in coming weeks.
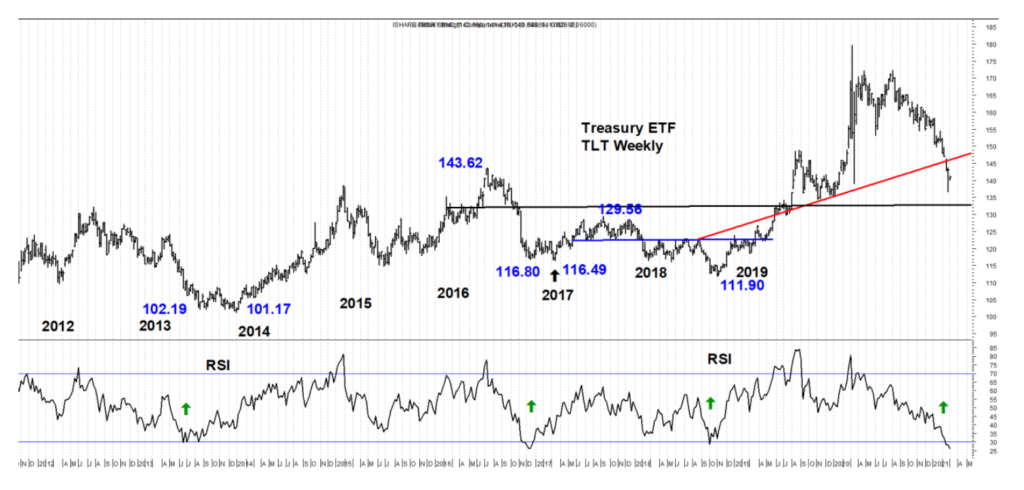
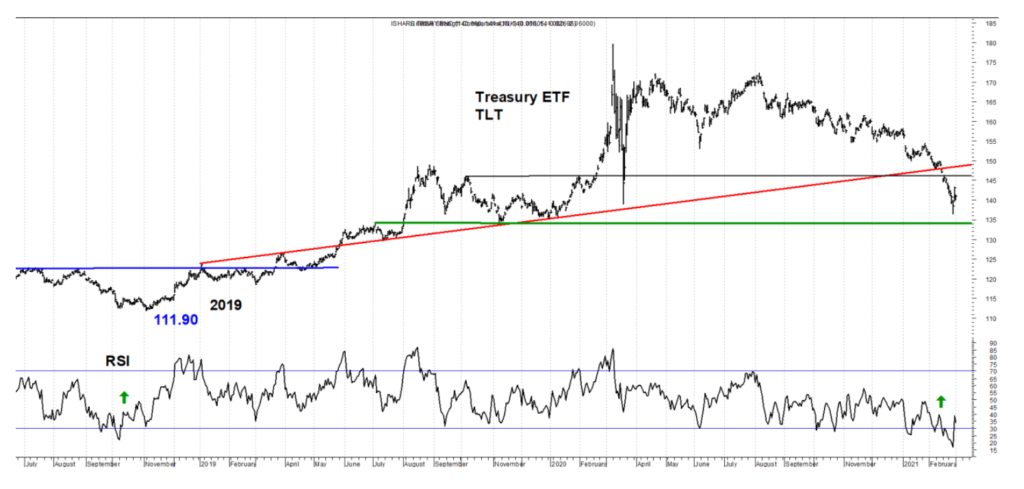
The Treasury bond ETF (TLT) is correlated to changes in the 30-year Treasury yield. Since 2012 the Weekly RSI for TLT has dropped to 30 on four occasions (green arrows). In June 2013 after the Taper Tantrum, December 2016 after President Trump won the election and bond holders were worried about his promised tax cut. TLT’s RSI fell below 30 in October 2018 after the bond market was distressed about rate increases by the Federal Reserve. The fourth time is last week.

After Treasury bonds had become so oversold in the three prior instances, Treasury yields fell for a period of time before rising again, which caused TLT to record a lower price. After the secondary low TLT rallied as the 30-year Treasury yield declined. The smallest rally in TLT was from $116.49 to $129.56 in 2017.
The spike high on February 25 has all the earmarks of a wave 3 crescendo. The sharp reversal lower in the 30-year Treasury yield on February 25 from a high of 2.402% to a low of 2.177% on February 26 is consistent with the end of a wave 3. The yield decline to date would be considered wave 4 which could stretch out for a bit before wave 5 lifts the 30-year Treasury yield above its February 25 intraday spike high. TLT would be expected to fall below its intra- day low of $136.61, possibly approach the green trend line near $134.00, and record a positive RSI divergence. Once wave 5 is complete TLT would have the potential to rally to $146.00 (black trend line).

Jim Welsh
JWelsh@SmartPortfolios.com


