$KC1! Coffee: Price Trends and Future Outlook in the Commodities Market


$KC1! Coffee: Price Trends and Future Outlook in the Commodities Market
This week we will analyze the commodities market, with a focus on the future of coffee represented by the $KC1! ticker.
Since the formation of a resistance fractal on February 7, 2022, the price of coffee has been declining, reaching $142.05 after a -45.46% drop from the value of $260.45.
The December 2019 resistance formed at $142.45 is very close to the most recent support in January this year, which was at $142.05. This price behavior is an important indicator for the future of coffee.
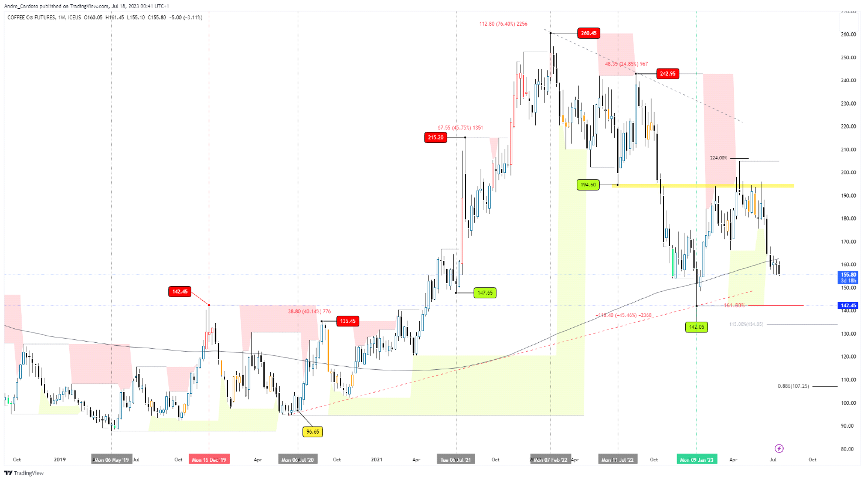
It is crucial to closely monitor any eventual break of this support, as it could pave the way for a more significant decline, potentially reaching $107.25.
However, before speculating too much, it is important to note that we should wait for a clear breakdown of the fractal support for the probability of this downward movement to increase and then materialize.
Looking at the previous price behavior, we can see that July has been a month of support in previous years.
On July 6, 2020, after weekly lows of $96.65, the price of coffee increased nearly 40% without major interruptions.
A year later, we saw weekly lows at $147.65, followed by an initial increase of over 45% and a total increase of approximately 76% until the highs in February 2022.
On July 11 last year, we had weekly lows at $194.60, with an attempted recovery of 24.85% and a new resistance fractal formed at $242.95.
Therefore, we should not discount the possibility of a positive movement in the future of coffee in the coming months of July and August.
Recent news reports that Kenya, another coffee producer, known for its high-quality coffee, has experienced a 5.4% decline in export revenue in the first quarter of 2023 compared to the previous year, with export volume also decreasing. This could lead to a tighter supply of high-quality coffees in the global market and upward pressure on prices of specialty coffees, if demand remains strong.
On the other hand, it is worth noting that the harvest in Brazil, the largest coffee exporter, typically takes place between May and September, with the peak of the harvest occurring in June and July. During this period, supply may increase, and depending on demand, there could be downward pressure on coffee prices.
Before getting involved with this or any other asset, it is necessary to analyze it technically and identify patterns that offer good risk management opportunities based on desired market movements and directions.
We suggest finding an appropriate price to expose oneself to potential future upward movements.
We will use Fibonacci levels and the most recent price structure to identify a bullish pattern, highlighting the fractal support from January this year, formed at $142.05.
This support is converging with the 161.8% Fibonacci extension, a potential reversal extension. Here, a harmonic pattern may form, supported by the Fibonacci ratios and variables presented so far.
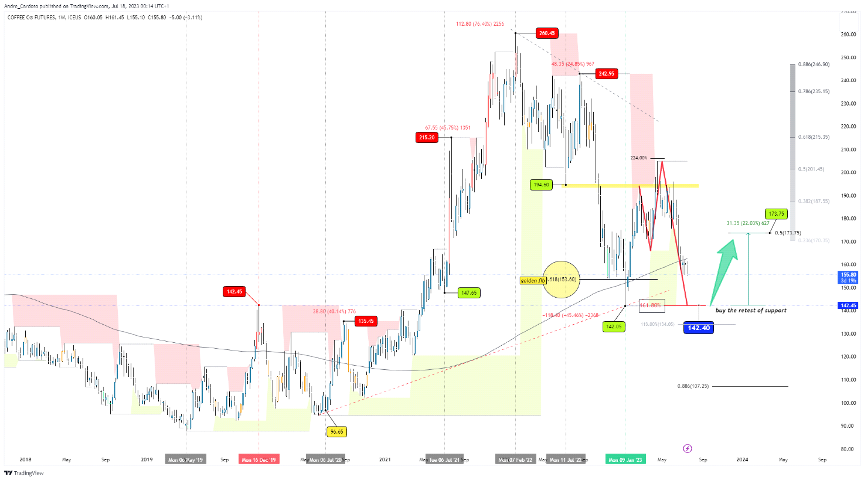
After the formation of this pattern, a upward movement can be expected up to $173.75, an attempt to recover about 22%.
However, it is important to note that a clear break below the support invalidates the harmonic pattern. Thus, we can minimize potential losses and manage positions well in case the market reacts accordingly.
Wishing you a fantastic day,
Good trades,
20230718