Introduction to Relative Strength or Ratio 1-1

Introduction to Relative Strength or Ratio 1-1
CMT Association’s Market Insights features timely technical analysis of current global markets by veteran CMT charterholders. Each post appears on www.tradingview.com/u/CMT_Association/ in an effort to explain process, tools, and the responsible practice of technical analysis. Shared content and posted charts are intended to be used for informational and educational purposes only. The CMT Association does not offer, and this information shall not be understood or construed as, financial advice or investment recommendations. The information provided is not a substitute for advice from an investment professional. The CMT Association does not accept liability for any financial loss or damage our audience may incur.

Introduction to Relative Strength or Ratio 1-1 by CMT_Association on TradingView.com
This is part one of a series on relative strength ratios.
Part One:
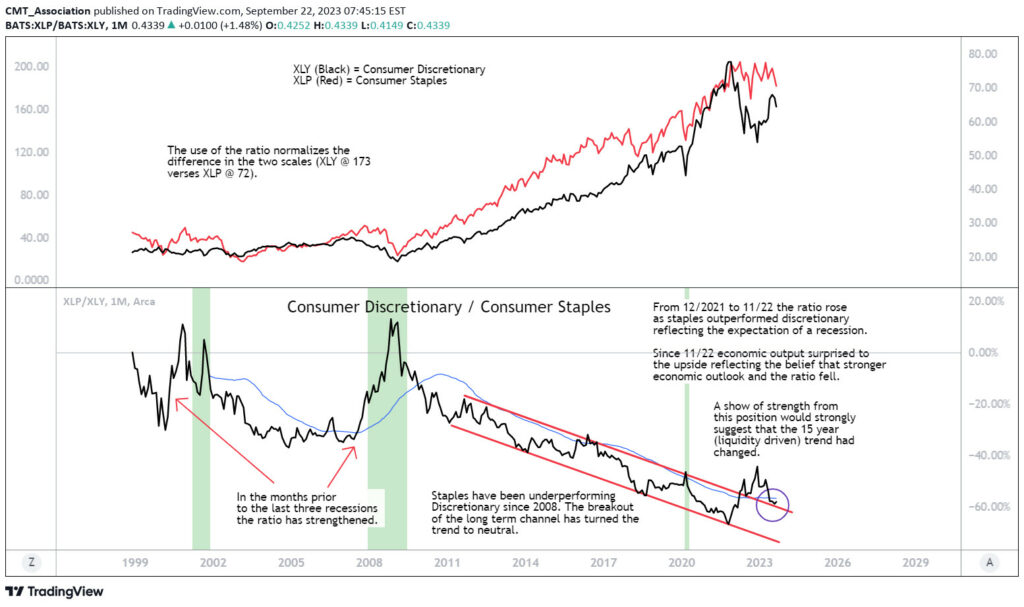
Relative Strength Ratio (RS) analysis is used to compare one markets performance with that of another. The RS line provides a direct comparison of strength or weakness relative to the another. RS analysis is particularly useful for active institutional managers who are judged relative to a benchmark as opposed to individual investors who are constrained by producing an absolute return. But understanding ratios opens a world of spread or pairs trading and provides valuable insight into the market environment. To be clear, the relative strength ratio has nothing to do with Welles Wilders Relative Strength Index (RSI). RSI is a momentum oscillator designed to evaluate a single security as opposed to a ratio comparing one security to another.
Using ratio analysis, bonds can be compared to equities, commodities to bonds, domestic equities to global equities, gold to copper, country to country, currency to currency, industry sector to industry sector, specific companies or sectors to broader indices, country to country and even individual equities. Choices of pairs are extensive. Importantly, once charted, the RS line can be analyzed as any other security. Support and resistance, channels, and momentum indicators can all be applied to the RS line. With literally thousands of securities to be compared the limits of RS analysis is only limited by the imagination of the analyst. The analyst does need to be careful. There needs to be a clear and intuitive economic linkage between the two securities before setting up ratio charts. There can also be issues when two securities, despite having a clear linkage, have a dynamic third variable such as currency translation or large differences in duration such as the LQD/HYG example that we will cover in future parts.
Relative Strength is calculated by dividing one security’s price by a second security’s price (the “base” security). The result of this division is the ratio, or relationship, between the two securities. When the RS line is rising, the numerator (top) security is outperforming the denominator (bottom) security. When the numerator security is falling, the numerator is underperforming the denominator security. If the RS is moving laterally, there is no performance advantage to either the numerator or denominator.
When looking at spreads I mostly prefer to use the ratio rather than the net price difference between two markets. Using ratios allows the analyst to make comparisons between markets priced in different units. For instance, Oil and Gold or cotton and the CRB. One exception to this would be when directly comparing one ratio to another ratio. In this case both ratios need to be normalized to a common starting value (I use 100) to adjust for large differences in numerators that could skew the RS line higher or lower relative to the RS line.
I find ratios most useful over longer time perspectives for business and economic insight. However, many traders/investors use them in shorter time perspectives as they create spread trades or aggressively switch between sectors. When I was actively trading bond/note futures I used extremes and technical analysis of the RS line on the hourly chart to help manage my curve trades.
In this series we will explore the construction of relative strength ratios, their best use, and make technical evaluations of several ratios and what that analysis implies.
And finally, many of the topics and techniques discussed in this post are part of the CMT Associations Chartered Market Technician’s curriculum.
Good Trading:
Stewart Taylor, CMT
Chartered Market Technician
Taylor Financial Communications
Shared content and posted charts are intended to be used for informational and educational purposes only. The CMT Association does not offer, and this information shall not be understood or construed as, financial advice or investment recommendations. The information provided is not a substitute for advice from an investment professional. The CMT Association does not accept liability for any financial loss or damage our audience may incur.

20230925


