Financials Struggle as Rates Remain Low


The long-term story of the financial sector is one of underperformance. This has been primarily due to an unprecedented low interest rate environment, driven by the Fed’s efforts to boost the economy.
That picture changed in the fourth quarter of 2020, when the ten-year Treasury yield started rising. The push up to the key 1% level saw the financial sector outperform the S&P 500 along with other cyclical sectors like materials and industrials.
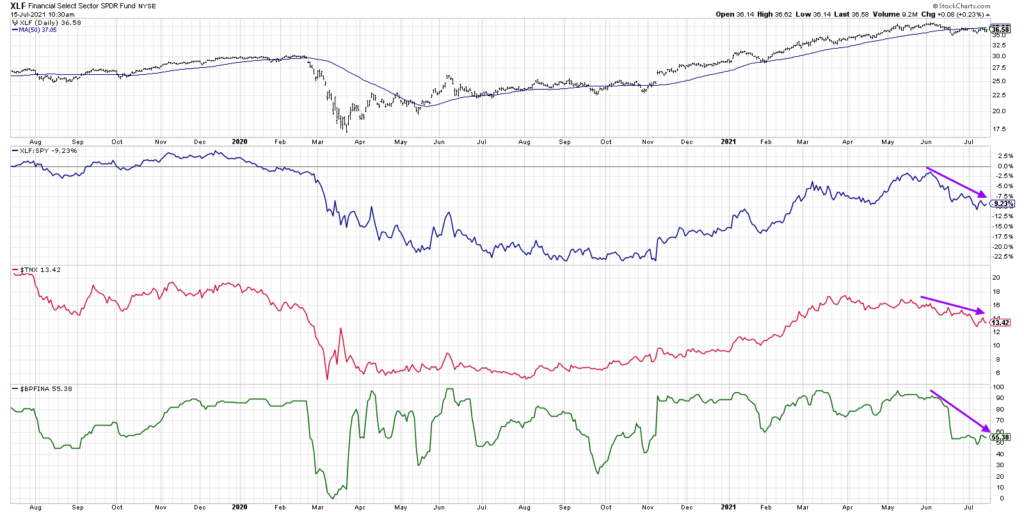
Note how the direction of the ten-year yield (red line) served as a leading indicator here. Interest rates began to rise in the summer of 2020, and the XLF didn’t really improve on a relative basis until November!
Now move to April and May of this year, and you can see how interest rates once again served as a leading indicator for financials. The TNX peaked in late March around 1.75%, and the financial sector made one more relative high in early June before rotating lower through this week.
The lesson? If you want to get a read on the financial sector, look at the ten-year yield.
Fast forward to this week and you’ll see that rates continue to push lower, having recently dipped below 1.3% for the first time since February. As long as the downtrend in interest rates persists, the probability of the financial sector outperforming is minimal.
For one final read on the banks, let’s review the Bullish Percent index for the financial sector.
The Bullish Percent index (green line) is a breadth indicator based on point & figure charts. Basically, you take a group of stocks and review every one of their point & figure counts. Was the most recent signal a buy signal or a sell signal? The Bullish Percent index simply tells us what percent of the stocks are in a buy signal.
In a healthy bull market phase, the index or sector would be making higher highs and higher lows, and the Bullish Percent index would be at a high level. This suggests that the market is moving higher and a broad group of stocks are participating in that upward movement.
The Bullish Percent index for financials, however, tells a very different story.
In today’s chart, you’ll note that over the last two months the Bullish Percent index for financials has come down from 95% to 55%. That means that a full 40% of the S&P members in the financial sector have registered a sell signal.
This speaks to the internal weakness in the sector as well as the struggle for financials to outperform given the continued low interest rate environment.
What would change the configuration of this chart?
Many banks are reporting earnings this week, with names like JPM bouncing off of key support levels before this week’s earnings call. Look for stocks like to JPM to hold support at previous lows around 145-146, otherwise a breakdown of key support levels could indicate further downside potential.
It seems clear that over time the Fed will begin to change its dovish stance and begin to make comments and take action that will lead to higher rates and a more supportive environment for banks to outperform. Until then, the path of least resistance remains down.
For deeper dives into market awareness, investor psychology and routines, check out my YouTube channel!
RR#6,
Dave
PS- Ready to upgrade your investment process? Check out my free course on behavioral investing!
David Keller, CMT
Chief Market Strategist
https://www.StockCharts.com
David Keller, CMT is Chief Market Strategist at StockCharts.com, where he helps investors minimize behavioral biases through technical analysis. He is also President and Chief Strategist at Sierra Alpha Research LLC, a boutique investment research firm focused on managing risk through market awareness. He is a Past President of the Chartered Market Technician (CMT) Association and currently serves on the CMT Curriculum and Test Committee. David was formerly a Managing Director of Research at Fidelity Investments in Boston as well as a technical analysis specialist for Bloomberg in New York. You can follow his thinking at MarketMisbehavior.com, where he explores the relationship between behavioral psychology and the financial markets.
Disclaimer: This blog is for educational purposes only and should not be construed as financial advice. The ideas and strategies should never be used without first assessing your own personal and financial situation, or without consulting a financial professional.
The author does not have a position in mentioned securities at the time of publication. Any opinions expressed herein are solely those of the author, and do not in any way represent the views or opinions of any other person or entity.