Critical Intersections for Small Caps, Retail, Semis, and Long Bonds


Critical Intersections for Small Caps, Retail, Semis, and Long Bonds
Written Michele ‘Mish’ Schneider and Wade Dawson
The overall market is at a crucial intersection.
Let’s take a deeper look at a few Modern Family members focusing on semiconductors (SMH), long bonds (TLT), small caps (IWM), and retail (XRT).
These sectors will be crucial to determining the market’s trajectory for the rest of the year.
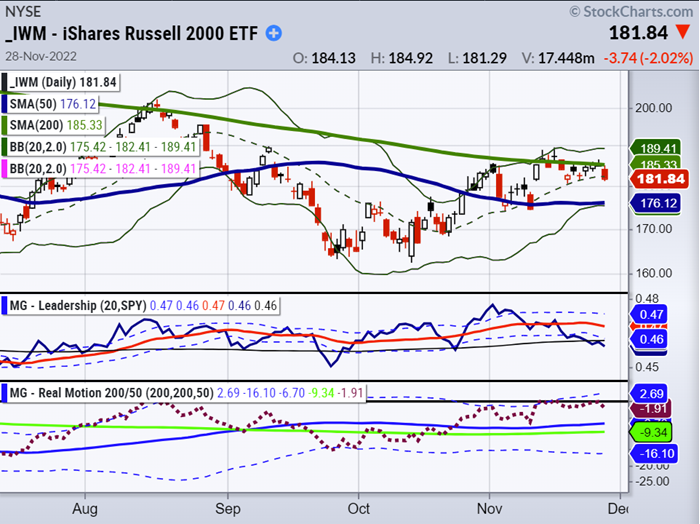
You can see on the daily chart above on Grandpa Russell (IWM) how close IWM is to the 200-day moving average, serving as resistance to higher highs. Also evident is lower support for IWM, around 176.
Small caps are displaying weak momentum in our Real Motion Indicator. Our Leadership/Triple Play Indicator also exhibits weak leadership performance relative to the S&P 500 (represented by SPY above).
If IWM can get through 190, that would indicate that we will have a more sustained rally, but problems are ahead for if IWM breaks down below 182. So, what are the other key sectors telling us right now?
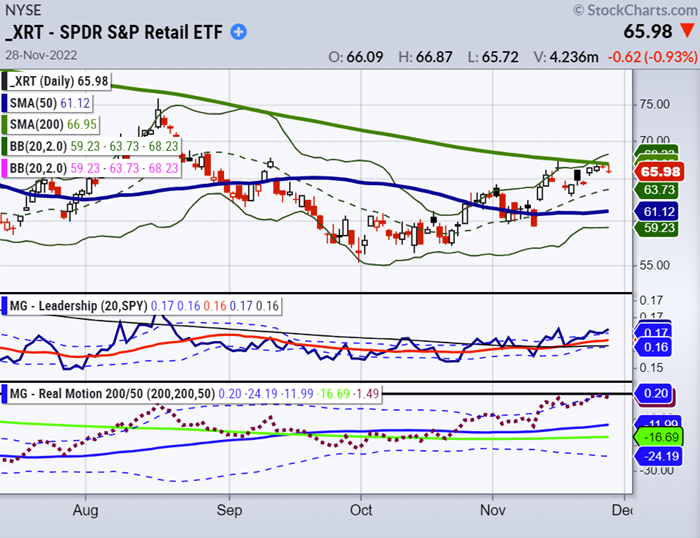
Retail sales were mixed over Black Friday, with online sales setting a record. XRT (Granny Retail) is at an intersection – if it breaks down under 67, it could go back to 64.
The Real Motion Indicator and Leadership/Triple Play Indicator signal Granny Retail’s price still has momentum strength and leadership displayed. If XRT can get through 66-67.55, that will be a big positive for the US consumer. Otherwise, we might see a move down.
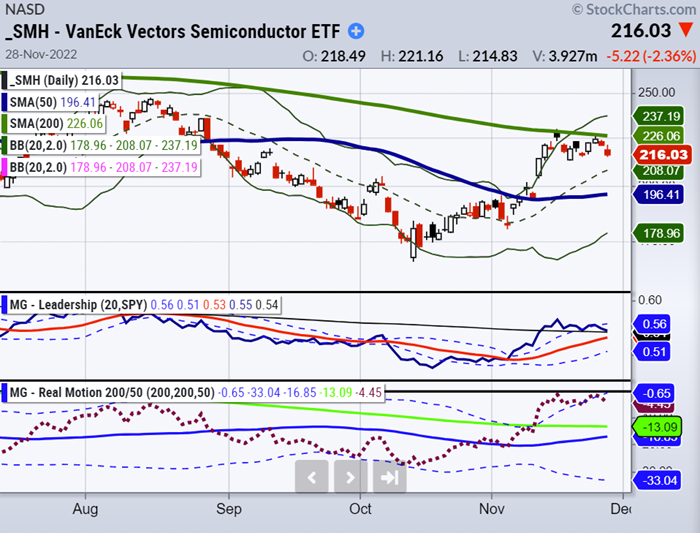
The Leadership/Triple Play Indicator for SMH also exhibits strong leadership performance relative to SPY above indicating continued outperformance.
But if SMH breaks 212, it could fall back to 200 near the 50-day moving average signaling continued weakness in the tech sector.
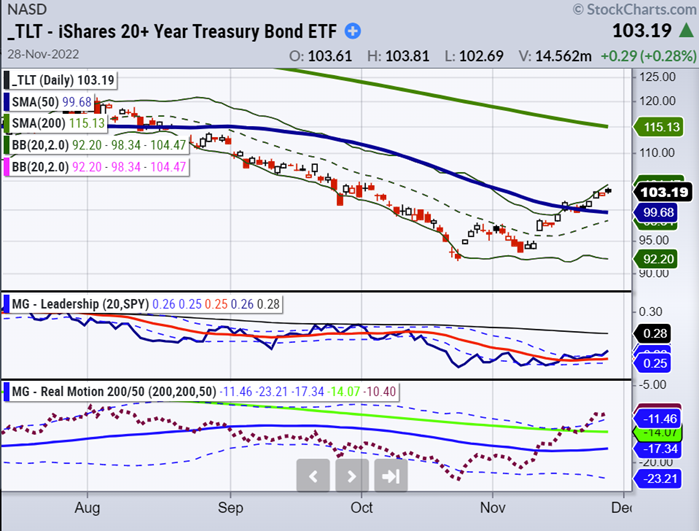
Bonds have been in demand as a safe haven asset, but this may not continue as rates rise.
The TLTs Leadership/Triple Play Indicator exhibits strong leadership performance relative to the SPY, indicating continued outperformance.
TLTs (long bonds) still need to go through 103.85. They need to cross this price to indicate a more bullish sustained move upward.
At this point, it’s hard to say if the market is in a risk-on or risk-off mode.
We will continue to watch these sectors and if the sectors can’t rally and get over these price levels, it could be a sign of trouble ahead.
Rob Quinn, our Chief Strategy Consultant, can provide more information about our proprietary trading indicators and Mish’s trading service. Click here to learn more about Mish’s Premium trading service with a complimentary one-on-one consultation.
Get your copy of “Plant Your Money Tree: A Guide to Growing Your Wealth”
Grow Your Wealth Today and Plant Your Money Tree!

“I grew my money tree and so can you!”- Mish Schneider
Mish in the Media
StockCharts 11-28-22Market at Critical Intersection, Your Daily Five
CMC Markets 11-09-22What’s next for key sectors after US midterms?
Business First AM 11-08-22Why We Love the Metals
UBS Trending 11-04-22Inflation and Fed Outlook 2023
Charles Payne 11-04-22Fox Business, Oil Markets Roil Fed
ETF Summary
S&P 500 (SPY) 390 support and 400 resistance
Russell 2000 (IWM) 178 support and 184 resistance
Dow (DIA) 335 support and 342 resistance
Nasdaq (QQQ) 278 support and 286 resistance
KRE (Regional Banks) 60 support and 65 resistance
SMH (Semiconductors) 210 support and 220 resistance
IYT (Transportation) 219 support and 227 resistance
IBB (Biotechnology) 129 support and 135 resistance
XRT (Retail) 63 support and 68 resistance
20221129