Technical Analysis DayTradeIdeas

Technical Analysis DayTradeIdeas
Trade ideas for Tuedsay 21st February 2024
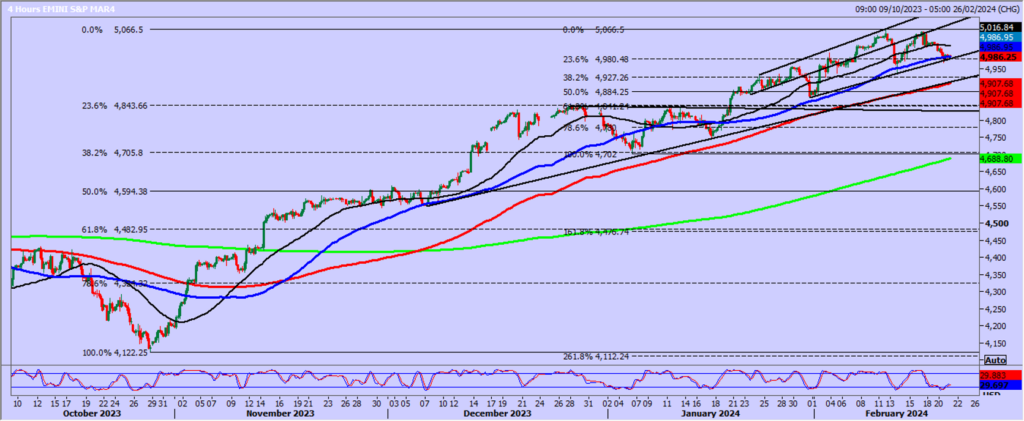
Emini S&P March futures reversed from 5059, just 7 points from the all time high at 5066, set on Monday last week.
Obviously a break above here is a buy signal & initially targets 5090/94.
However we do have a potential double top pattern after the rejection on Friday. It’s only small & would require a break below last week’s low at 4936 for confirmation of a short term sell signal but if you are looking for an excuse to short the index this is the best one for a while. Shorts need stops above 5070, so the downside risk is small & if we do break below 4935 we can target 4850/40 so there is a profit taking 3:1 risk vs reward.
In the short term, for scalpers we have some support at 4985/75 (with a low for the day at 4968 yesterday) but a break below 4965 today risks a slide to 4930/25, perhaps as far as 4900/4895.
Nasdaq March futures reached 18026, just shy of the all time high at 18100/120.
A break above 18130 can target 18300/330.
However, Friday’s bearish engulfing candle on the daily chart, just below the all time high is a warning for bulls. Friday’s peak was not close enough to Monday’s all time high to call it a double top but the price action suggests a period of consolidation, if not a short term (minor) correction to the downside.
We broke good support at 17700/650 but must hold below below 17500 if we are to see further losses targeting 17460/420, (which held the downside yesterday) perhaps as far as a buying opportunity at 17230/180. Longs here need stops below 17100.
Emini Dow Jones March futures beat resistance at 38600/650 to hit my next target of 38880/900 with a high for the day exactly here.
We can only scalp at this stage in the 2 week sideways consolidation as there are no swing opportunities until we see a breakout of the range. With minor support at 38600/550 (which did hold the downside yesterday) & 38350/300, longs need 50 point stops on these scalping levels & look for a 200 to 300 tick profit. Any recovery meets the all time high at 38980-39012. Above here we look for 39160/220. A break above 39270 targets 39450/500.

Daily Technical Analysis is provided by Jason Sen of Day Trade Ideas, who has been day trading since the late 1980’s. Jason has been a contributor of Traders Summit since the beginning. He primarily focuses on providing technical analysis of the financial markets, including stock chart patterns, Forex and Metals setups, and other useful technical analysis.
Join Telegram https://t.me/daytradeideas
Please email me if you need this report updated or Whatsapp: +66971910019 – To subscribe to this report please visit daytradeideas.co.uk or email jason@daytradeideas.co.uk
Jason Sen, Director
https://www.daytradeideas.co.uk
20240221


