S&P500 and Nasdaq


S&P500 and Nasdaq
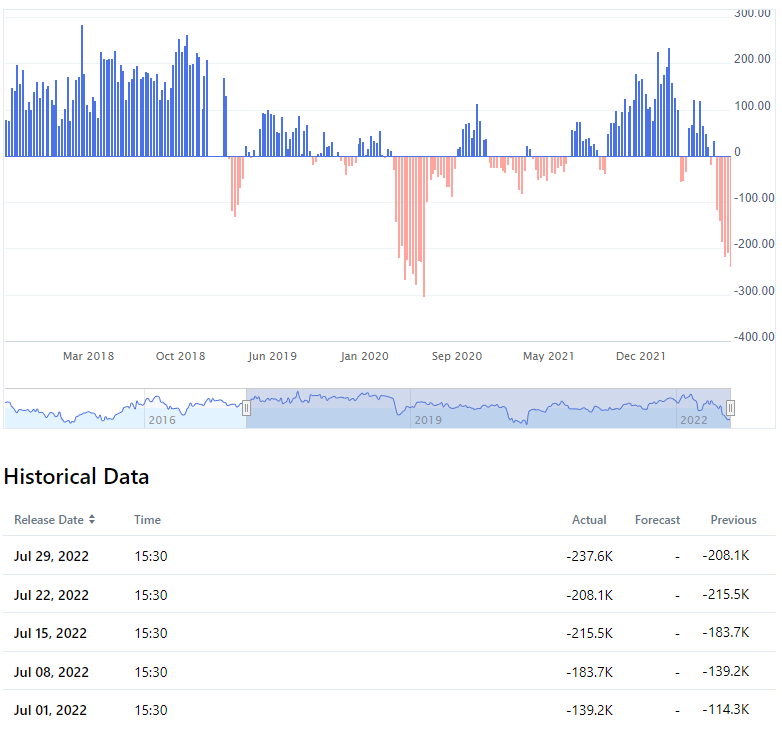
As US indices continue to rally higher many people are confused about why this is happening. But sentiment explains most of it. When the crowd turns bearish and almost everyone starts selling the rise, the market ends up in a short squeeze that drives markets higher. This is happening across world markets. In the US, we can look at the CFTC noncommercial speculative longs reported below that increased to 237k short even as the market moved higher for the 6th week since the June bottom.
S&P 500 is in a pullback mode, and the pullback seems to be a complex correction. So far, S&P 500 has completed a minor degree w-x, and currently, y is in progress. Within wave y, wave a and b are possibly complete, and now wave c is in progress. At 4220, wave a and c of y will be equal. On the way down, yesterday’s low of 3910 will be an immediate support level to watch out for in the near term. Broadly the bear market rally should retrace 61.8% of the entire fall from January and that could mean a little above 4240 before we turn lower. It should ideally coincide with short positions going back to zero.

The Nasdaq Composite is bouncing back in wave B, which can mean an over 50% retracement of wave A based on records. So we are looking at something over 13400 before the rally in US tech stocks is over. A long way to go. By then, the weekly RMI [momentum] will be above zero as well, and we will be lower to the upper end of the weekly Bollinger bands.

20220801