It might seem that if you have an edge, the way to maximize the edge is to trade as big as you can. But that’s not the case, because of risk. As a professional gambler or as a trader, you are constantly walking the line between maximizing edge and minimizing your risk of tapping out.~ John Bender
In this week’s Dirty Dozen [CHART PACK] we look at even more evidence in support of the bullish thrust in US equities, we then talk easing financial conditions, confirming internals, a bearish consensus, an N&N Buy Signal, pitch a short USD play, and more…
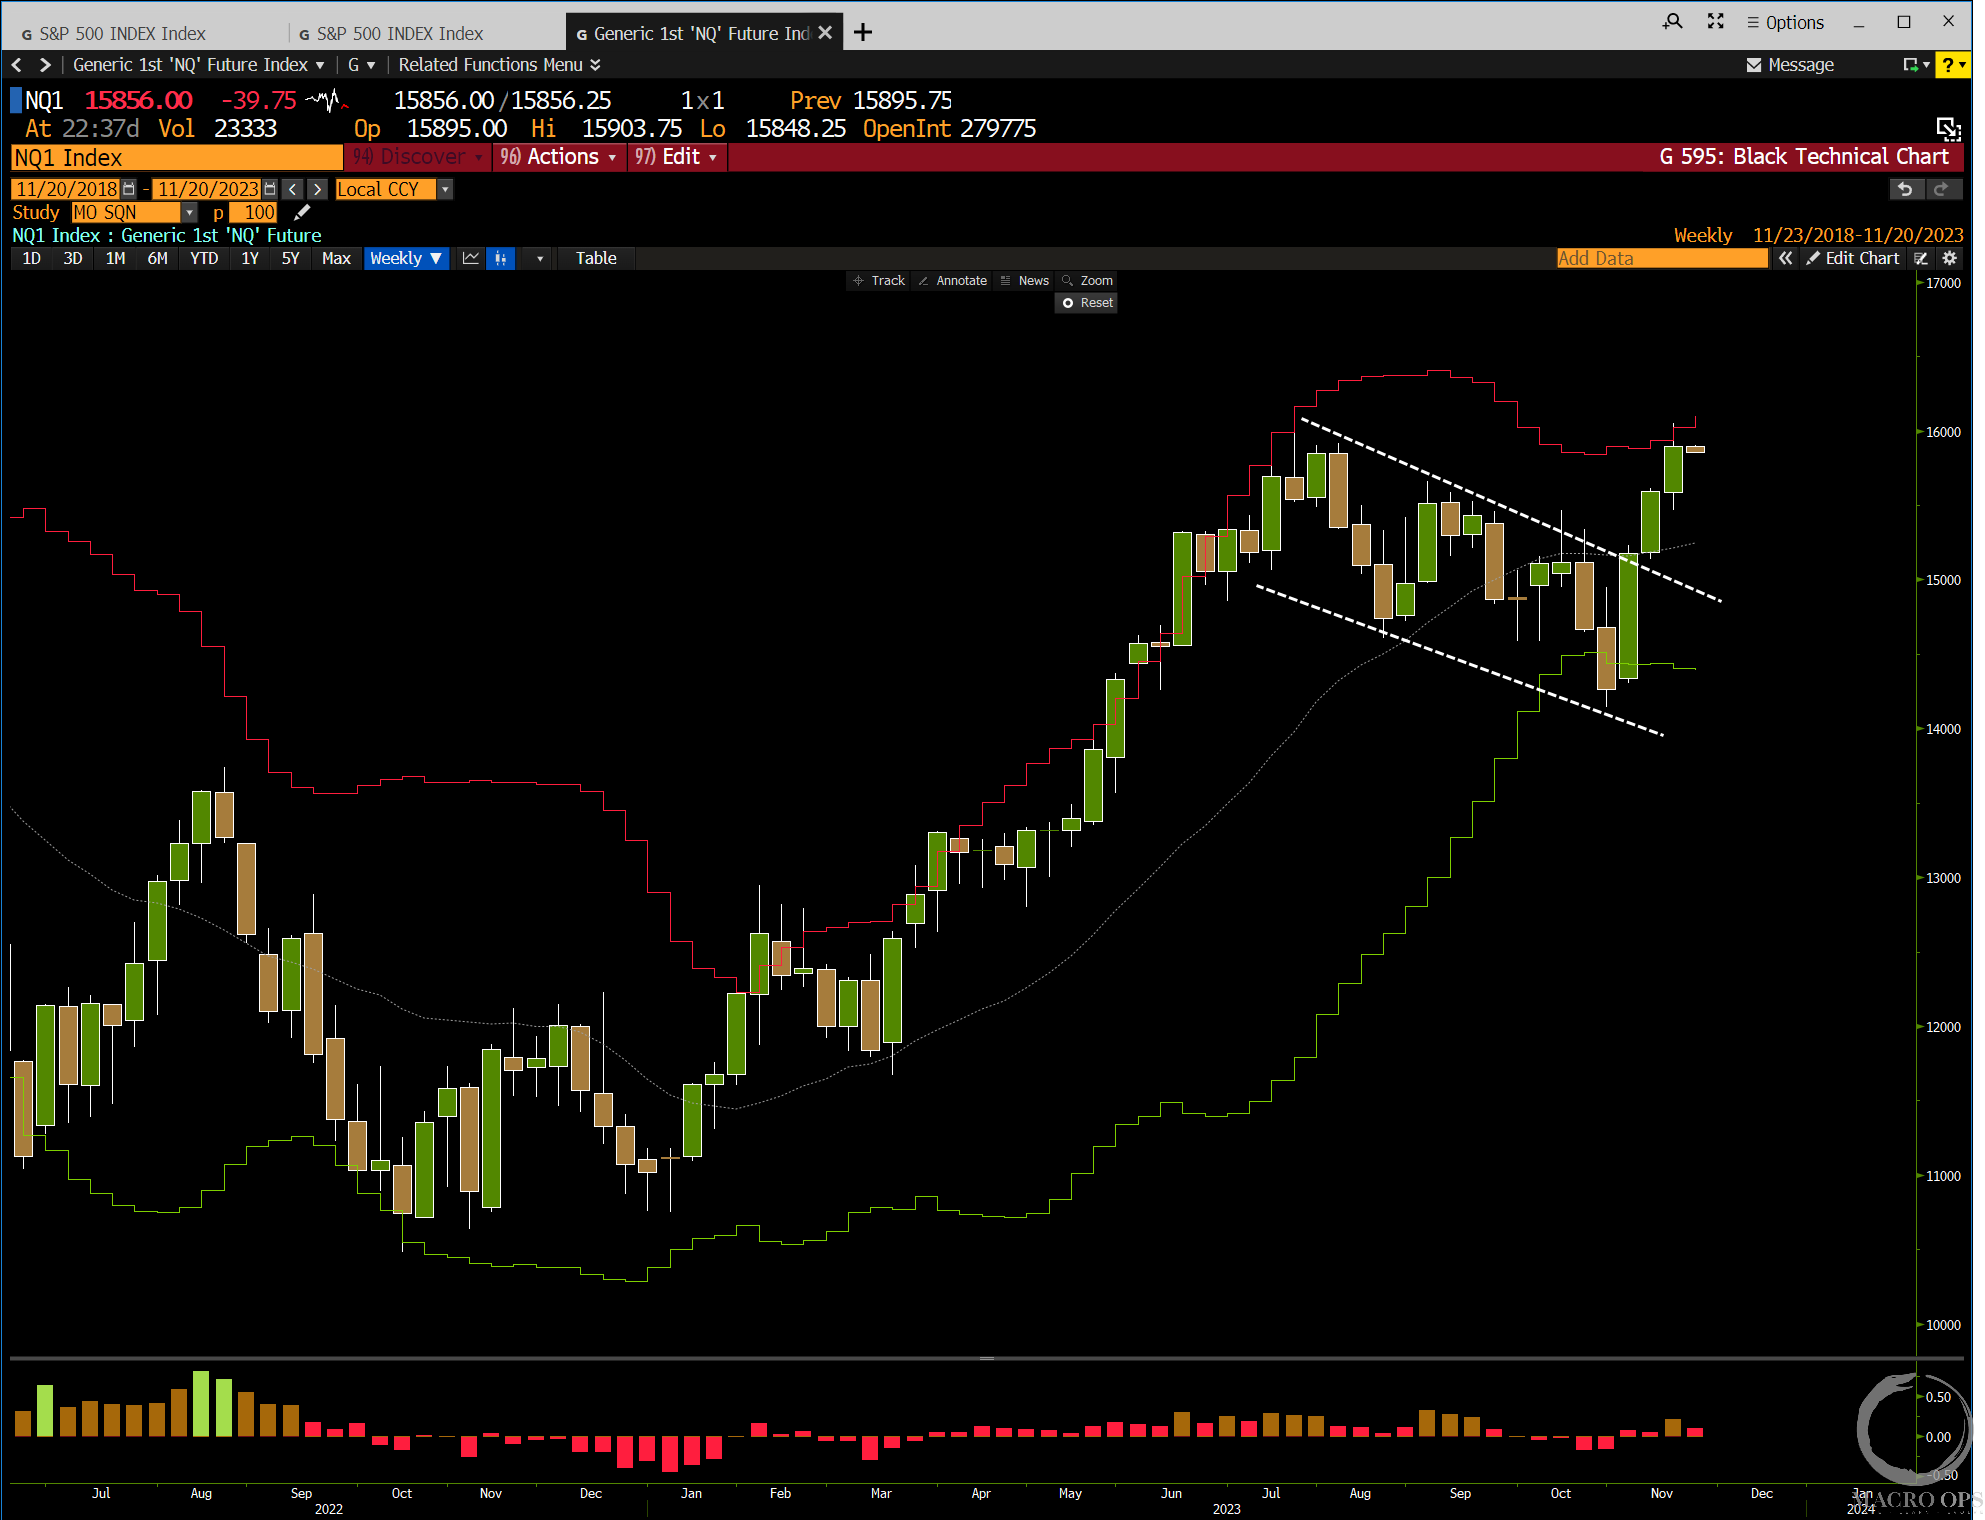
1. The bullish breakout in the major US indices continues to follow through. The Qs are now bumping up against their upper weekly Bollinger Band and they’re more than 2std extended from both their 20 and 50-day moving averages.
This is a positive sign in the long term as it signifies a strong buying impulse, with the backdrop of poor sentiment. But it also means that the market is susceptible to a pullback/consolidation over the short-term here, which would give us a good opportunity to add to our position (chart below is a weekly).
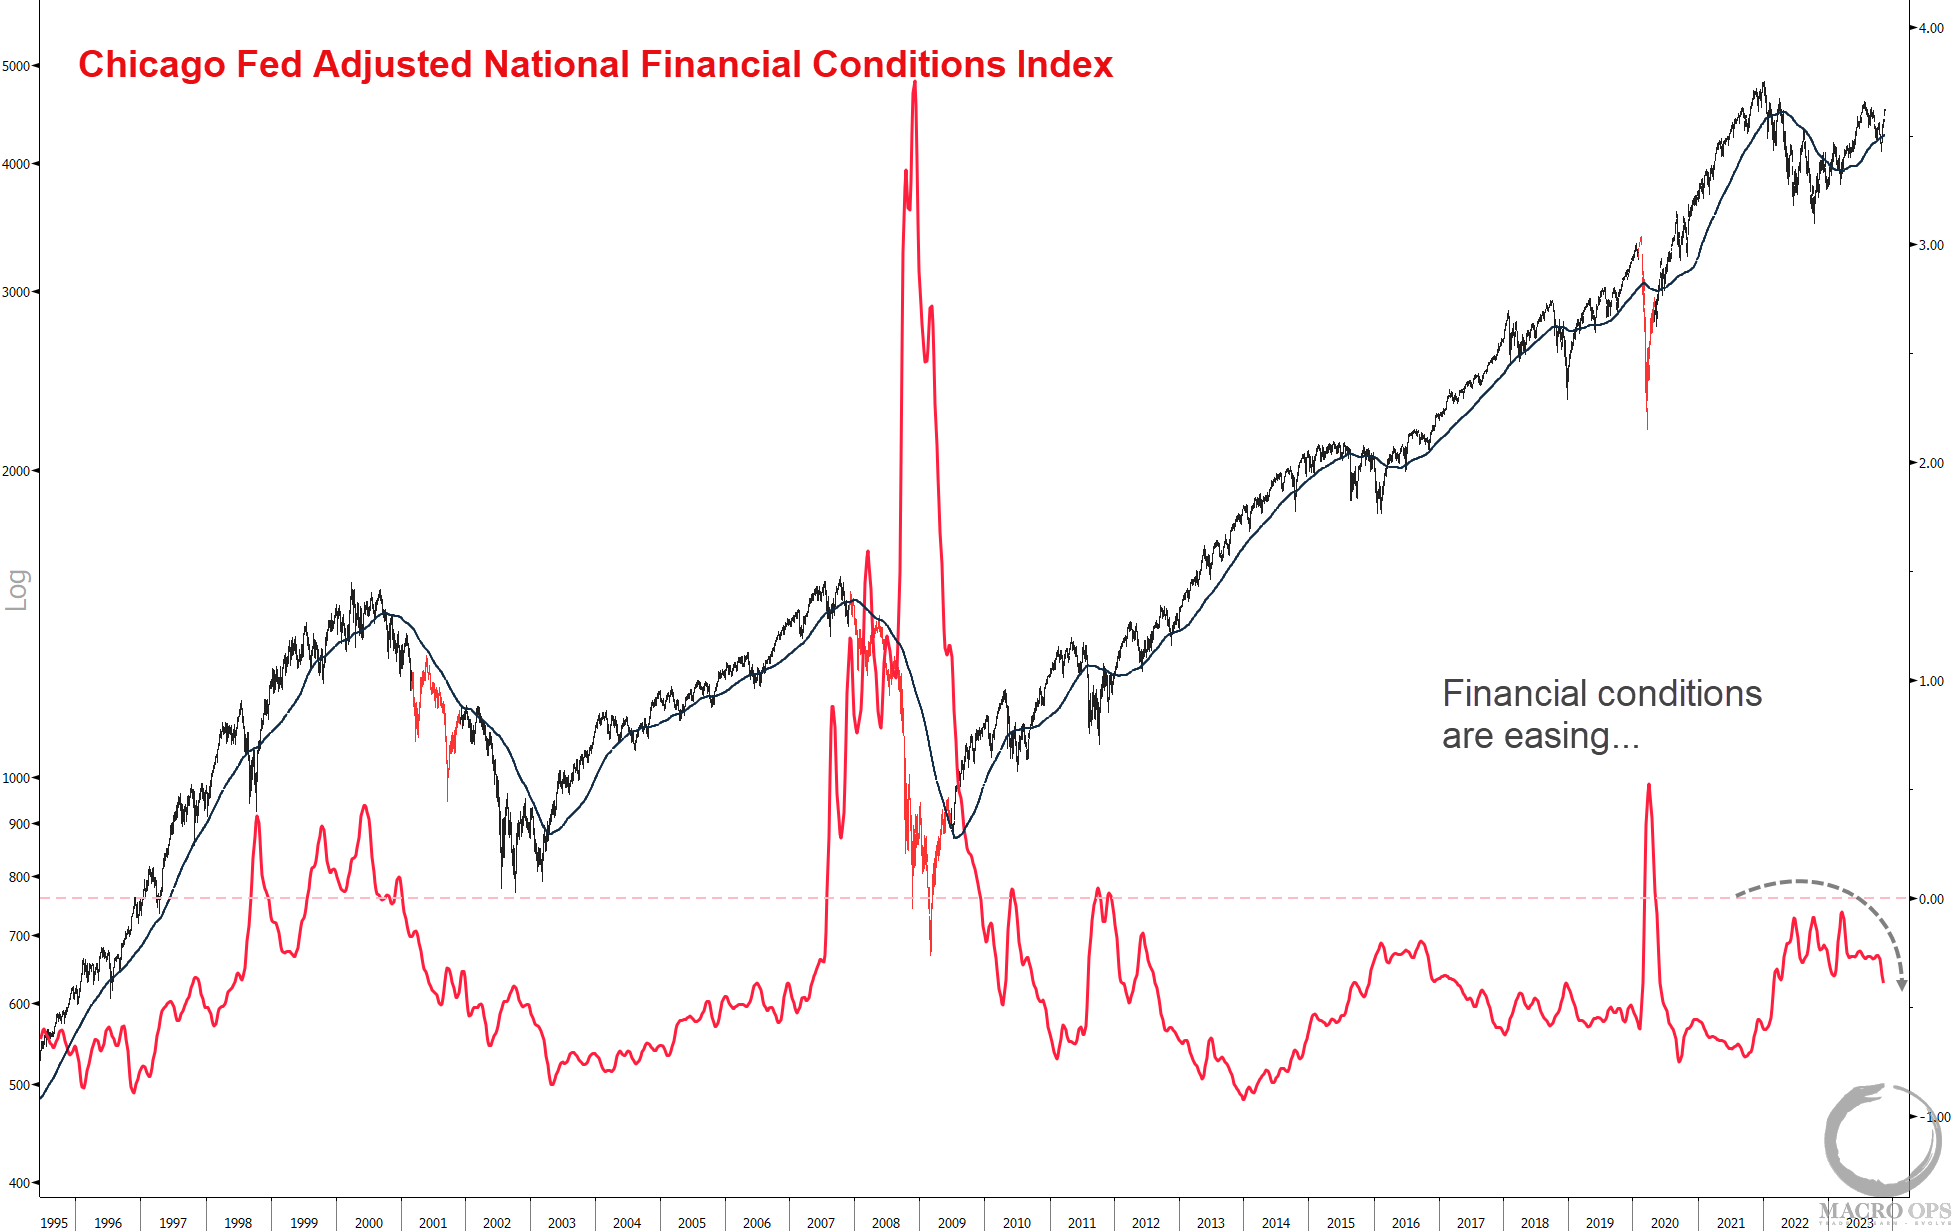
2. I’ve been writing that this is one of the more important charts to be keeping an eye on. It’s the Chicago Fed Adjusted National Financial Conditions Index (ANFCI), which is a composite of indicators that measure three categories (1) risk (2) leverage and (3) credit, which updates weekly. A reading below zero (horizontal red line) means liquidity is easy and vice-versa for when it’s giving a positive reading. Recently, the chart has begun to roll over and trend down from its 12m+range. This means that financial conditions are at their easiest levels in over a year according to the ANFCI. This is NOT bearish…
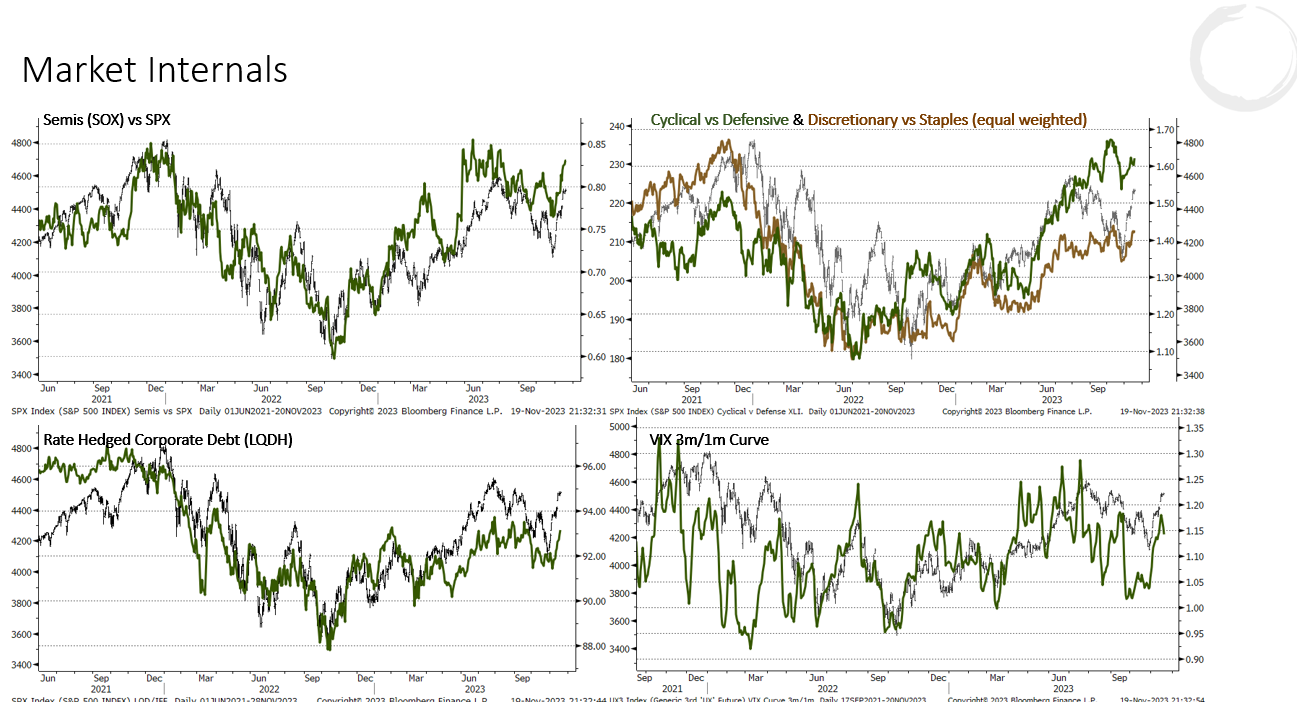
3. All of our market internals continue to confirm this bullish thrust.
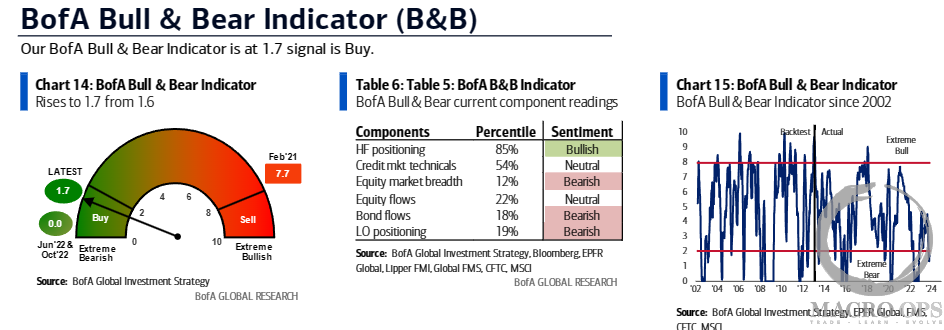
4. And the BofA Bull & Bear reading gave its 5th consecutive buy signal last week.
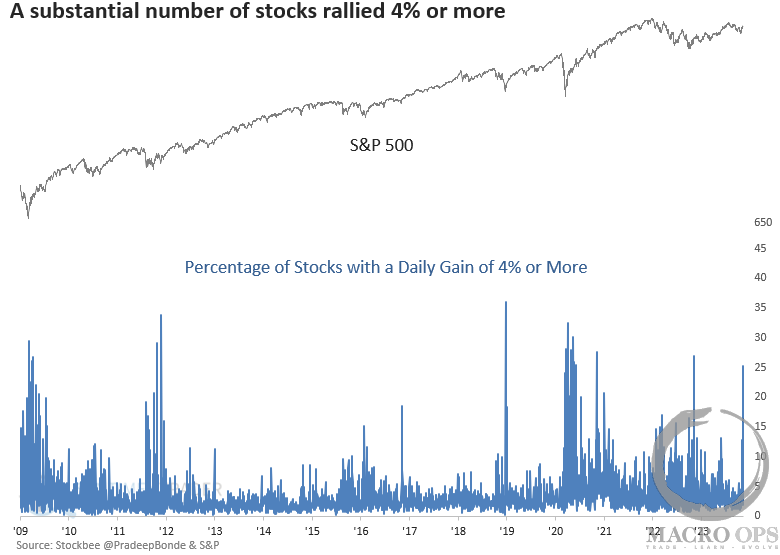
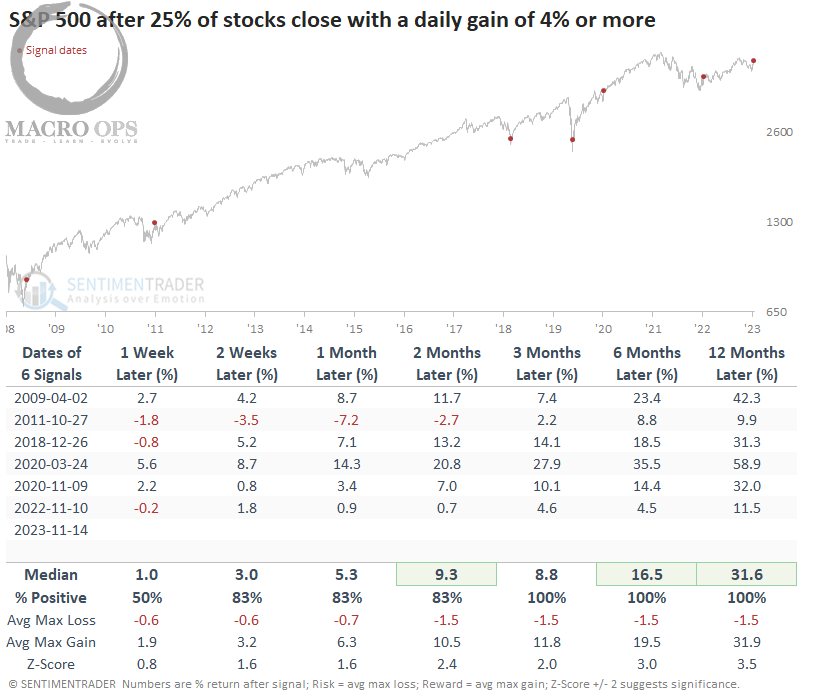
5. And we saw more confirmatory breadth thrusts last week. SentimenTrader writes:
“While the sample size is small, whenever 25% of stocks close up 4% or more in a single session, the S&P 500 rallied 100% of the time over the subsequent three, six, and twelve months.”
6. Here’s ST again: “An analysis using sub-industry data over a significantly extended period confirms the bullish outlook, especially when the S&P 500 is in an uptrend like now. If history rhymes, traders should use any short-term weakness to add market exposure.”
We at MO agree.
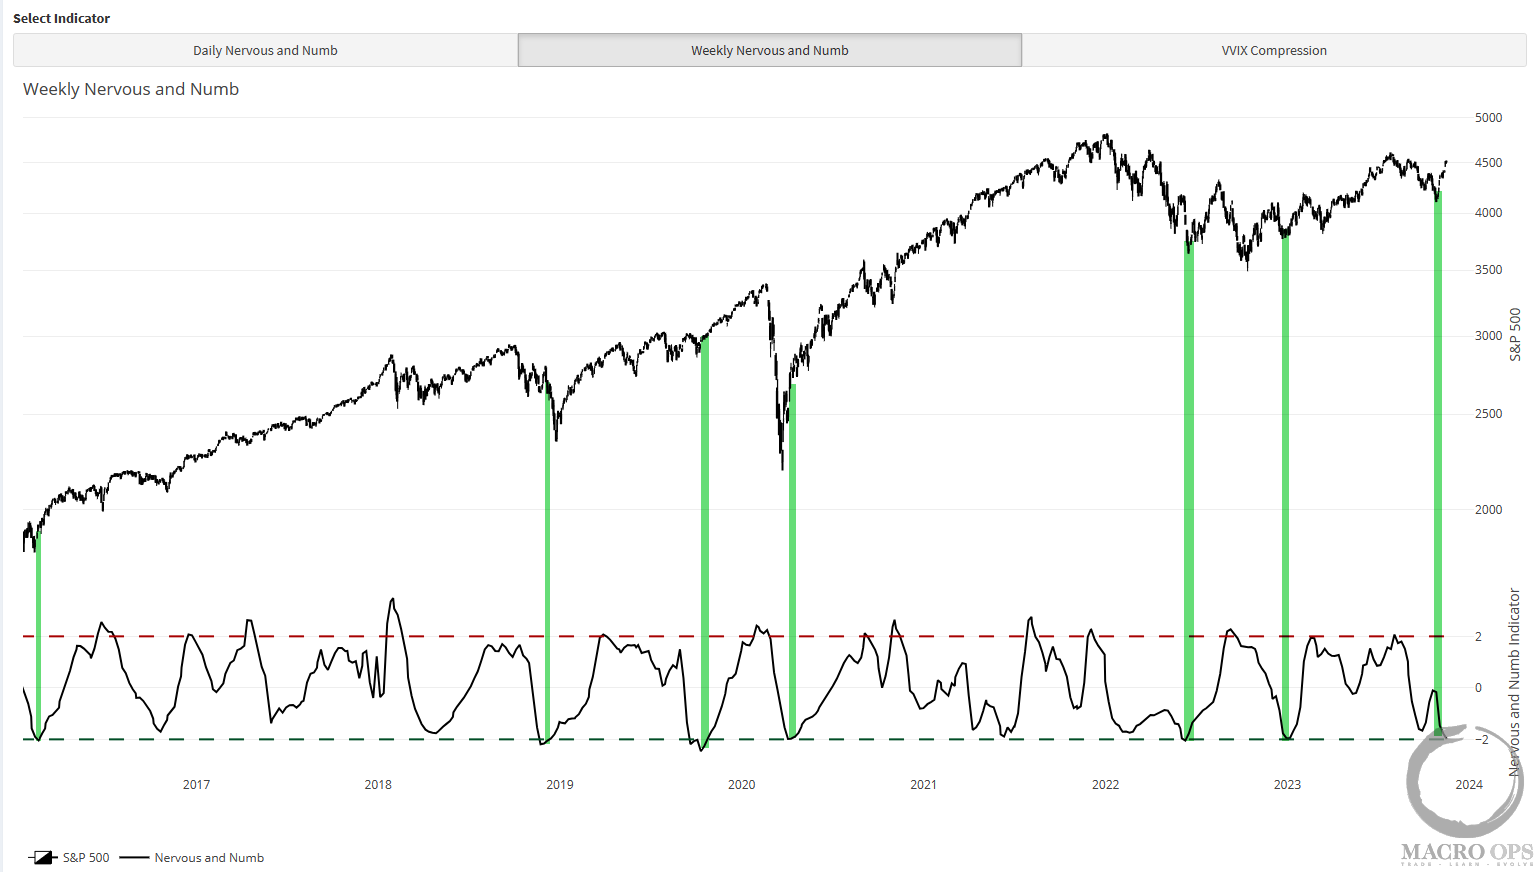
7. Our Weekly Nervous and number indicator also triggered a 2std low buy signal last week. Past signals are marked in green. This indicator tracks the relative relationship between the Vix and the SPX. As you can see it has a pretty good record at marking intermediate lows in the market.
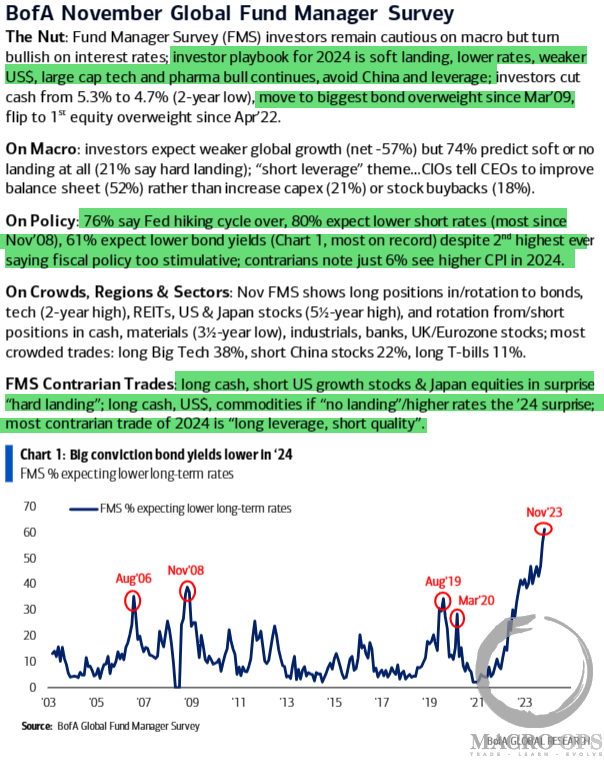
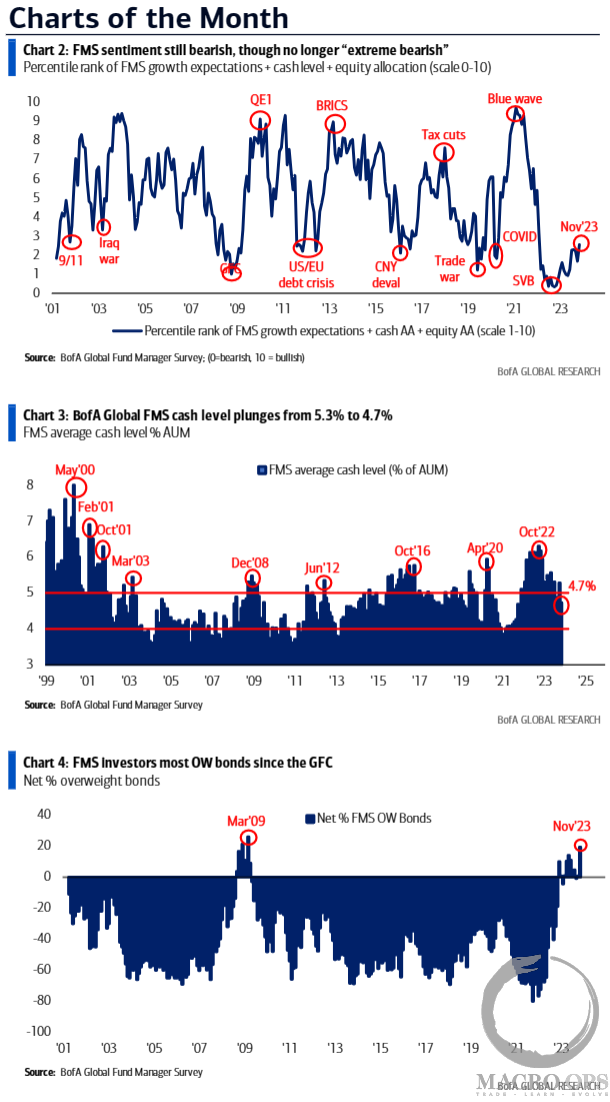
8. Here’s the summary with highlights from the latest BofA Global Fund Manager Survey.
9. And the charts of the month from the report. Lots of bond bulls out there…
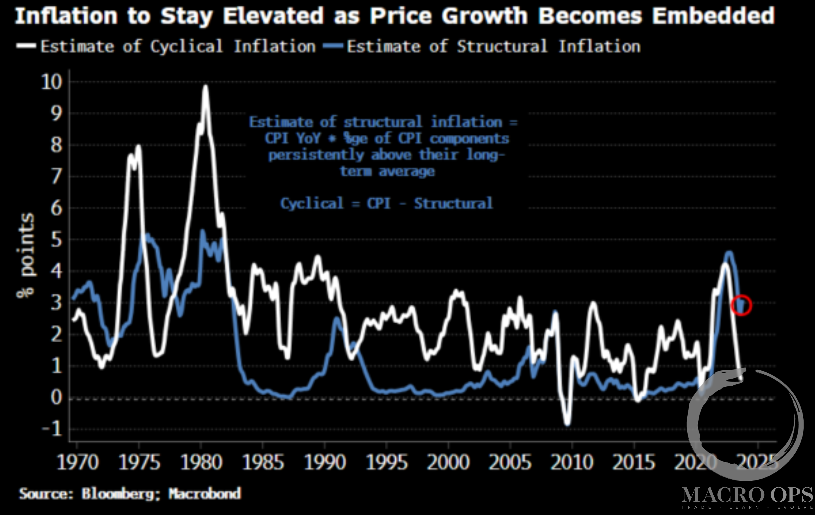
10. Simon White writing for BBG shared the following last week:
“Inflation is poised to start reheating soon as it becomes structurally embedded. This makes a sustainable rally in bonds unlikely, especially when US recession risk is receding.
Consensus is looking for a decline in October headline consumer prices to 3.3% from 3.7% last month, and for core to hold steady at 4.1%. As BBG Economics highlight, the pace of decline in inflation is stalling, or in the case of core it has already stalled.
We get the same message by separating all of the CPI components into those that are cyclical and those that are structural… The drop in cyclical CPI has driven most o the fall in the headline number in this cycle, while structural CPI has started to turn back up from an historically still-elevated level. Inflation therefore is likely to start rising again as the price growth of structural CPI components becomes entrenched.”
We don’t necessarily agree or disagree with Simon. But this is a potential we’re closely tracking.
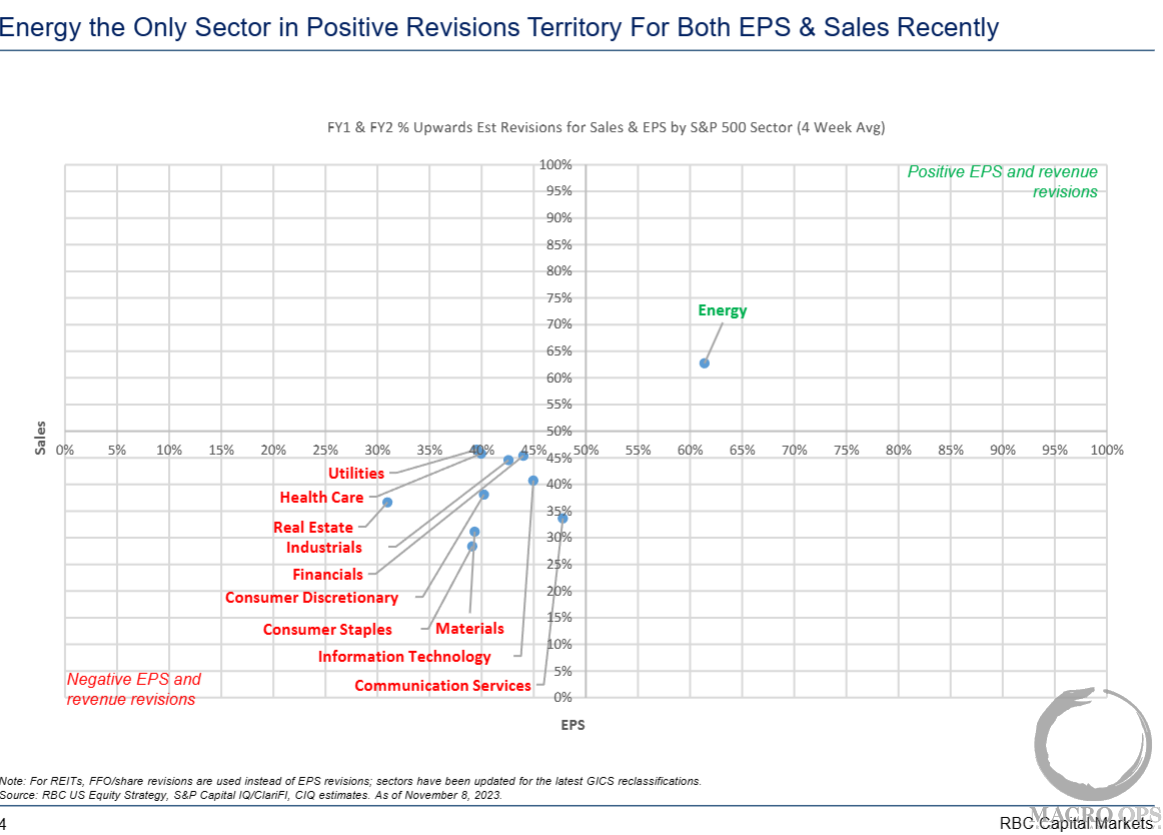
11. Energy is the only sector with positive revisions for both EPS and revenues according to RBC Capital Markets.
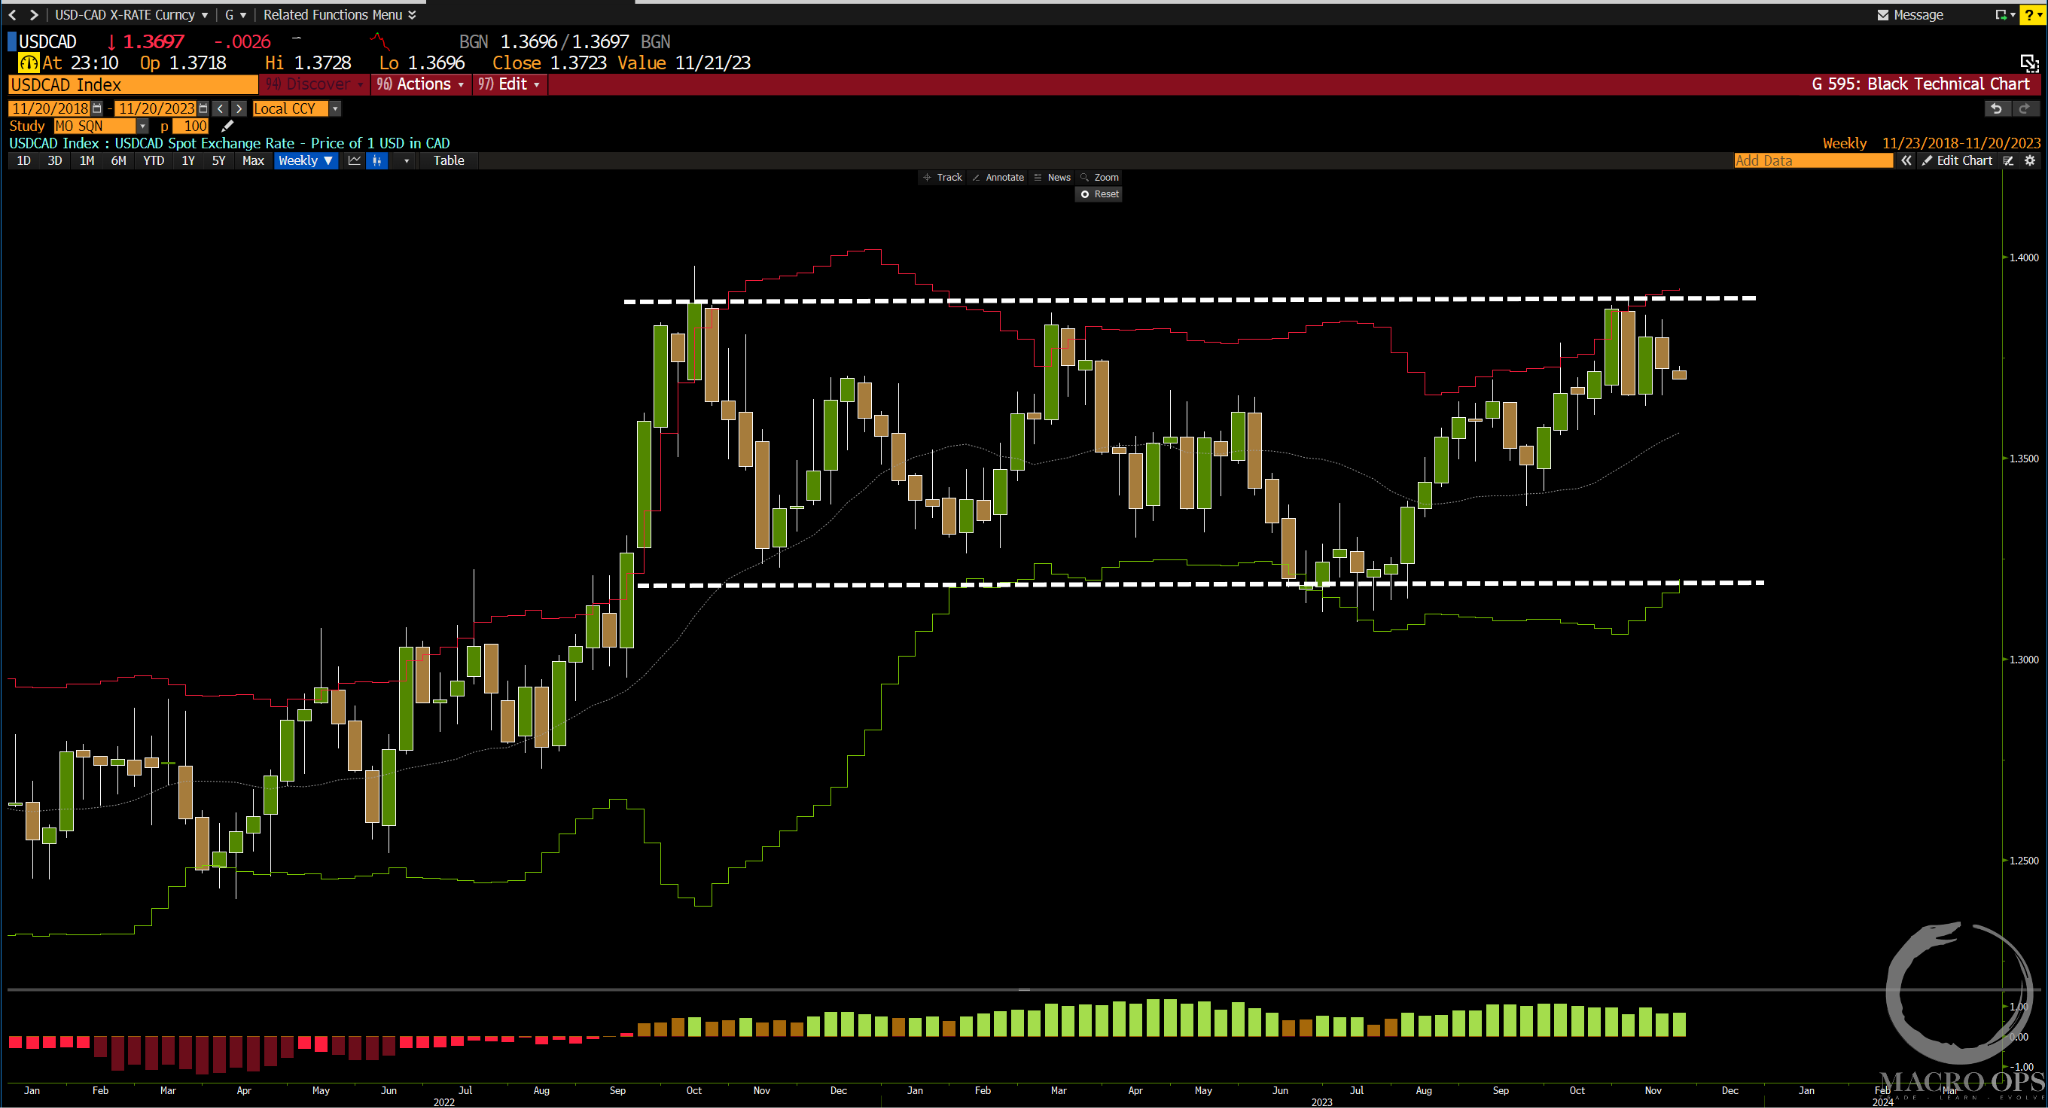
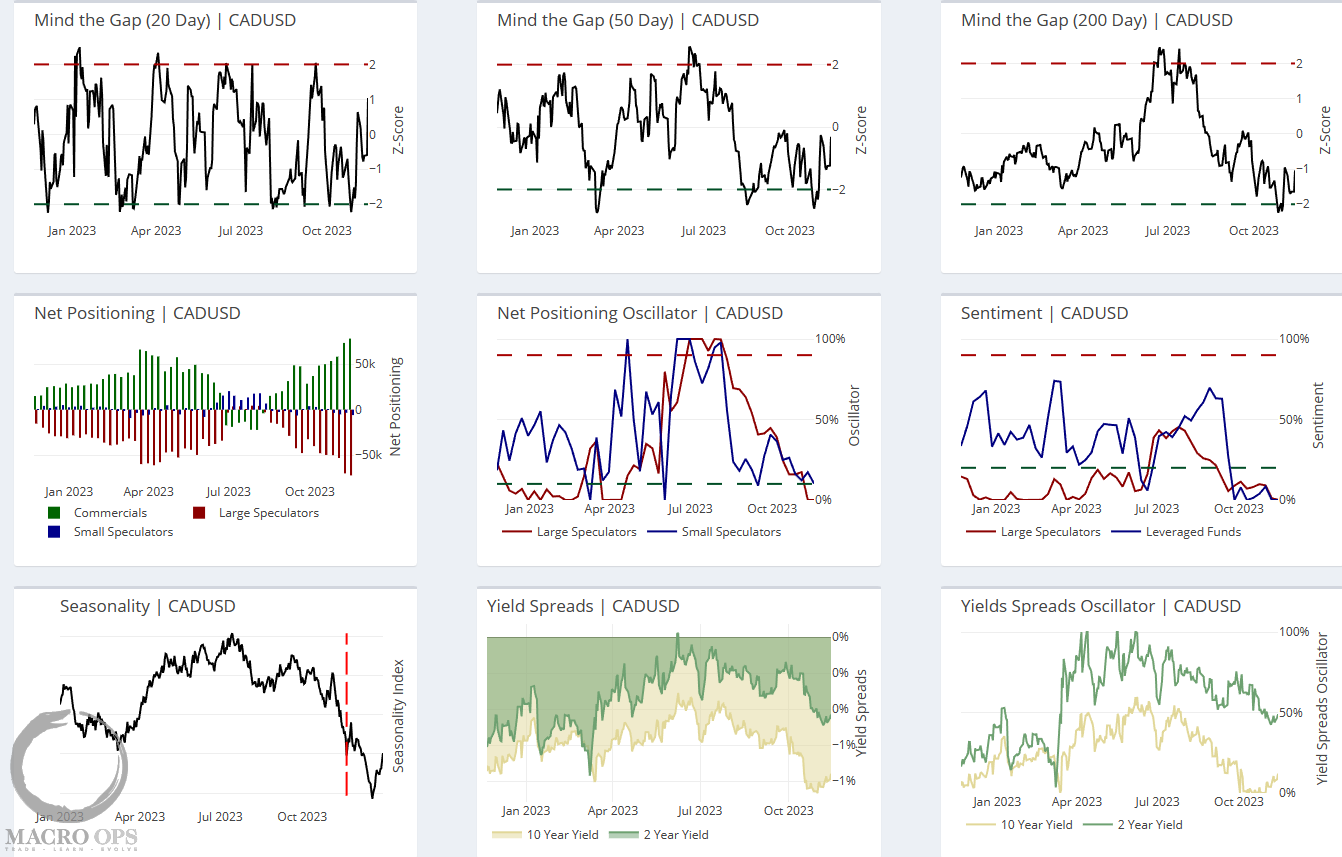
12. I’m looking at getting long CAD (short USDCAD) this week. It’s at the top of its 12m sideways range. Positioning for both large and small specs is crowded short, while its 2s and 10s yield spread oscillator is starting to turn up in CAD’s favor.
This website uses cookies to improve your experience. We'll assume you're ok with this, but you can opt-out if you wish. Cookie settingsACCEPT
Privacy & Cookies Policy
Privacy Overview
This website uses cookies to improve your experience while you navigate through the website. Out of these cookies, the cookies that are categorized as necessary are stored on your browser as they are essential for the working of basic functionalities of the website. We also use third-party cookies that help us analyze and understand how you use this website. These cookies will be stored in your browser only with your consent. You also have the option to opt-out of these cookies. But opting out of some of these cookies may have an effect on your browsing experience.
Necessary cookies are absolutely essential for the website to function properly. This category only includes cookies that ensures basic functionalities and security features of the website. These cookies do not store any personal information.
Any cookies that may not be particularly necessary for the website to function and is used specifically to collect user personal data via analytics, ads, other embedded contents are termed as non-necessary cookies. It is mandatory to procure user consent prior to running these cookies on your website.