Mish’s Daily: NASDAQ New High / New Low Ratio and Risk


Mish’s Daily: NASDAQ New High / New Low Ratio and Risk
Written by Michele ‘Mish’ Schneider
Stuck is a word we have used a lot lately.
Some common synonyms for stuck are jammed, trapped, put, pushed, and caught.
Nasdaq is stuck, jammed, or whichever word one wishes to use.
And that’s price.
Traders are also trapped and caught considering that the market breadth is stuck in the middle between healthy and ill.
Our Big View product updates the market internals each day.
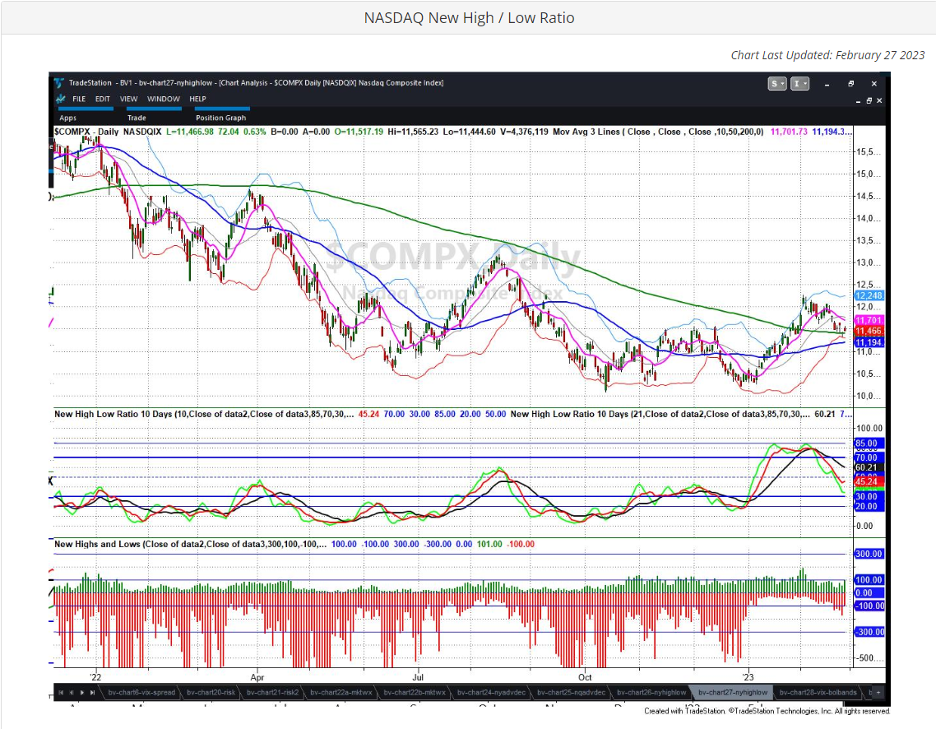
This particular indicator shows the number of stocks reaching a new 52-week high relative to the number of stocks falling to a new 52-week low.
A degree of finesse is required to read the current high/low ratio.
On a short-term basis, we were starting to get to oversold levels in NASDAQ.
The 10-Day moving average (red line on the middle chart) flipped positive, meaning this February decline may be starting to turn up.
Meanwhile, the 21-DMA (black line) is above 50%.
When the value of the 21-DMA is above 70% it is considered bullish and very bullish over 85%.
When it is under 30% it is considered bearish and very bearish under 20%.
While NASDAQ got oversold on a shorter-term timeframe, the longer-term bias remains intact as long as it the 21-DMA is at or above 50%.
We are watching for a potential powerful bounce in NASDAQ, hence, bringing price back towards the higher end of the trading range and the 21-DMA closer to 70%.
Please also look at the bottom chart or the actual up/down ratio.
Monday, the 27th, there were an even number of red and green bars.
In the weeks prior, the stocks going up outpaced the number of stocks going down.
Now, once this market breadth chart updates, should the green bars rise above the red ones, then that is yet another positive sign for growth stocks and NASDAQ.
And of course, the opposite is true-more red than green means market could remain stuck.
To see more of our Big View indicators and the breakdown of risk on/neutral/off, please check out our Sunday Market Outlook.
Finally, we featured Century Aluminum CENX in yesterday’s Daily-up nearly 7% today. MarketGauge’s mission is to bring you education and actionable investing ideas every day!
For more detailed trading information about our blended models, tools, and trader education courses, contact Rob Quinn, our Chief Strategy Consultant, to learn more.
You don’t want to miss Mish’s 2023 Market Outlook E-available now

NOT TOO LATE Click here if you’d like a complimentary copy of Mish’s 2023 Market Outlook E-Book in your inbox.

Get your copy of “Plant Your Money Tree: A Guide to Growing Your Wealth”
Grow Your Wealth Today and Plant Your Money Tree!

“I grew my money tree and so can you!”- Mish Schneider
Mish in the Media
BizFirst AM-Stock Picking Time 02-28-23
BNN Bloomberg 02-27-23
Yahoo Finance Uncut 02-17-23 and our YouTube
CMC Markets Recap Post Fed Minutes 02-23-23
Fox Business-Making Money with Charles Payne 02-20-23
Business First AM-worst trade, best trade, next trade 02-21-23
CMC Markets on Commodities 02-16-23
StockchartsTV Final Bar with Dave Keller 2-14-23
Your Daily Five StockCharts TV 02-10-23
Kitco Article by Neils Christensen on the Gold Market–02-07-23
ETF Summary
S&P 500 (SPY) 390 support with 405 closest resistance
Russell 2000 (IWM) MA support around 184. 190 has to clear
Dow (DIA) 326 support 335 resistance
Nasdaq (QQQ) 284 big support 300 resistance
Regional banks (KRE) 65.00 resistance 61 support
Semiconductors (SMH) 228 support 240 pivotal 248 key resistance
Transportation (IYT) 235 resistance as best Mod Fam performer and 228 support
Biotechnology (IBB) 125-130 new range
Retail (XRT) 66-68 huge area to hold if the market still has legs
20230301