Mish’s Daily: How Will We Know When the Rally is Over?

Mish’s Daily: How Will We Know When the Rally is Over?
Written by Michele ‘Mish’ Schneider
I first became interested in junk bonds right before COVID hit in January 2020.
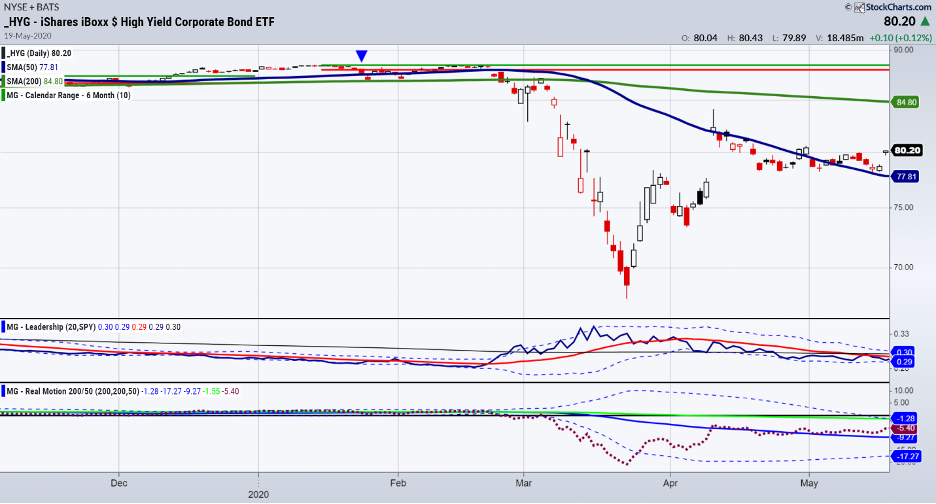
Note the price at the time of HYG was around 88.50.
Since HYG represents high yield/high debt companies that pay well in a risk on environment, what struck me in early 2020 was that HYG could not clear the horizontal green line or the top of the January 6-month calendar range high.
Then, at the end of January, or where the blue arrow is pointing on the chart, HYG broke the January 6-month calendar range low and the 50-DMA (blue) but held the 200-DMA (also in green).
In February, HYG tried a few more times to clear the January highs and could not.
When I saw HYG break below the 200-DMA at the end of February 2020, I started to pay attention.
As you can see, in March and with the news of Covid, mostly everything got hit hard.
That spectacular drop in HYG happened ahead of the news and ahead of the rest of the market’s drop.
Risk-off was glaring.
Once April began, HYG cleared back over the 50-DMA (blue) signaling to us the coast was clear to get back into equities.
What should we watch for now?
Present time
We all know how spectacular this rally has been to date.
Not only do we see new highs nearly every day in QQQ DIA and SPY, BUT the AI craze ALSO keeps elevating everyone’s mood and risk appetite.
Small caps are trying hard to clear back over 200 (IWM).
The long bonds are showing that rates have peaked but not necessarily going down anytime soon.
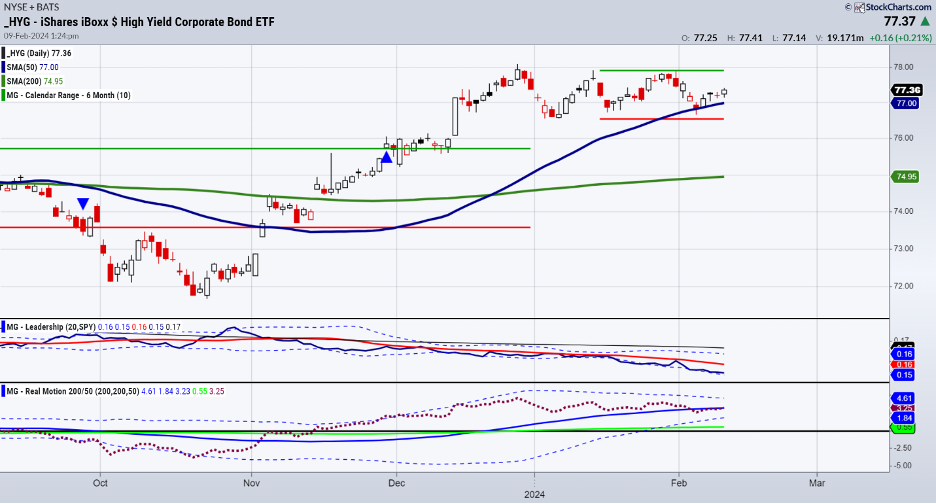
So, I have once again four years later, become extremely focused on how HYG is doing and will do.
Like early 2020, HYG has yet to take out its January 6-month calendar range high, while NASDAQ SPY and DIA have.
As we are almost halfway through February, HYG is acting stronger than it did in February 2020.
However, there are some warning signs to watch.
- 1. The price is in the middle of the January range which could mean we see HYG catch up to QQQ and risk remains on. But it could also mean HYG breaks the January lows.
- 2. HYG sits on the 50-DMA but has yet to leave a lot of distance between price and the moving average.
- 3. HYG well underperforms SPY in the Leadership indicator. This means that the money flow is not necessarily going towards a sustained risk-on environment. Rather, it illustrates the concentration of how few stocks are participating in this rally, while junk bonds traders are more cautious.
- 4. The Real Motion or momentum indicator is in a bit of a bearish divergence to price. With momentum under the 50-DMA, any further weakness in price could see momentum decline more sharply.
The bottom line is that we do not see the glaring warning in HYG at this time as we did in 2020.
Nonetheless, we see a bigger reason to watch junk bonds just as we did in 2020.
This type of underperformance, if leads to a break of the January calendar range or a phase change to caution, will give us a head’s up to also be more cautious at the very least. Then, we can take it from there.
For more detailed trading information about our blended models, tools, and trader education courses, contact Rob Quinn, our Chief Strategy Consultant, to learn more.
Come to the Money Show to hear me and many other great folks speak.


Get your copy of “Plant Your Money Tree: A Guide to Growing Your Wealth”
Grow Your Wealth Today and Plant Your Money Tree!

“I grew my money tree and so can you!”- Mish Schneider
Mish in the Media
Financial Sense with Jim Pupluva Credit card balances for US consumers are climbing. Is this yet a concern for the market and economic outlook? 02-07-24
CMC Markets Follow up on gold, oil, dollar pairs and S&P 500-short term trading with a bias 02-07-24
BusinessFirstAm Mish talks about Powell and how dispassionate the best traders have to be on the talk about rates 02-06-24
The Money Life with Chuck Jaffee Where Mish sees the markets going in the short and longer term 2024 podcast 02-06-24
Benzinga Morning Pre Market Mish sits with the team to discuss the recent job report and how a healthy economy is not the worst thing. It just means a reset of how investors invest 02-02-24
CNA Asia First Mish’s debut talking the Fed, inflation, big tech earnings and what investors should look out for 01-31-24
Money FM 89.3 Singapore Mish on breakfast bites talking earnings and interest rates-plus her made up ETF 01-31-24
Business First AM Mish talks briefly about oil and how we will know when geopolitics are heating up 01-30-24
Kitco News An Article with Neils Christensen on the direction for gold 01-30-24
Yahoo Finance 33 Charts for 2024 -Article
StockchartsTV How Calendar Ranges can Predict Market Direction-Mish and Geoff cover how this indicator tells you who and what to believe, when to act and what to trade 01-16-24
Coming Up:
February 14 Final Bar with Dave Keller
February 21-23 The Money Show in Las Vegas
February 26 CNA Asia First TV and Radio
February 29 Yahoo Finance
February 29 Your Daily Five Stockcharts
Weekly: Business First AM, CMC Markets
ETF Summary
S&P 500 (SPY) 500 now the pivotal point-perhaps we see 510 before we see 490.
Russell 2000 (IWM) 195 now support and the jan calendar range 201.50 must clear
Dow (DIA) Week ends with an inside day near ATHs. 385 key support
Nasdaq (QQQ) 430 support
Regional banks (KRE) Back to the 45-50 range
Semiconductors (SMH) Our sister semiconductor superstar. Support 196
Transportation (IYT) We started last week looking here and it did its job-now, 266 support
Biotechnology (IBB) 135 pivotal -like this sector but has more to prove
Retail (XRT) Granny did her job clearing 70. The Jan calendar range high at 73 now must clear
20240210