Is the Santa Claus Rally Over?


Is the Santa Claus Rally Over?
Written Michele ‘Mish’ Schneider and Wade Dawson
Bond prices plummeted, yields increased, and U.S. indexes fell again Monday.
The major U.S. indices have fallen for the past two weeks, and on Monday, most markets closed near their lows.
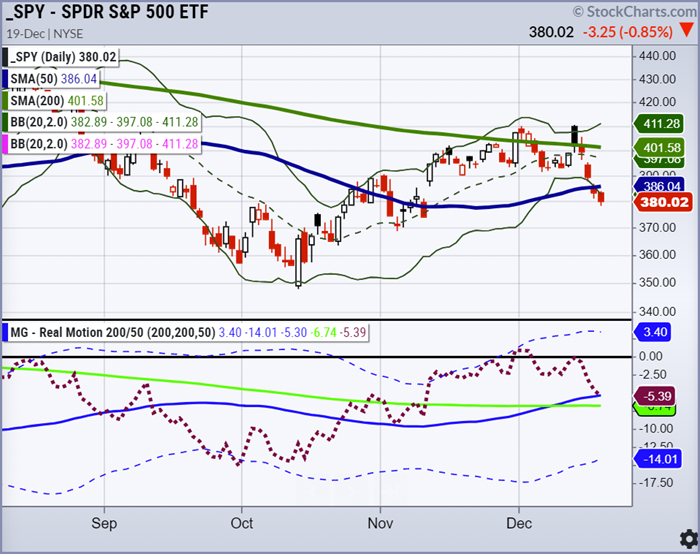
The S&P 500, represented by the SPY ETF above, closed significantly below its 50-day moving average today. The Real Motion Indicator above indicates that the SPY’s price is not oversold.
December usually is bullish during a mid-term election year, and seasonality favors higher stock prices, but not this month.
While conflicting signals exist, most of MarketGauge’s trading indicators have pointed to risk-off during December. The CPI print and subsequent December Fed hike are in the rearview mirror, but the relentless market selling prompts the question of whether any Santa Claus Rally will occur before 2023.
Sellers were clearly in control on Monday for the fourth consecutive trading day, so any further price deterioration this week should be respected.
The Real Motion Indicator above shows measured downward momentum in line with the S&P 500’s price decline.
This should provide traders and investors one more reason to be vigilant and not surprised if the market moves lower but also open to a Santa rally if key overhead price levels are swiftly regained.
Except for the Diamonds (DIA), all major US indices (SPY, QQQ, IWM) are below their 50-day moving averages, and in line with the Real Motion Indicator above, US indices are not oversold.
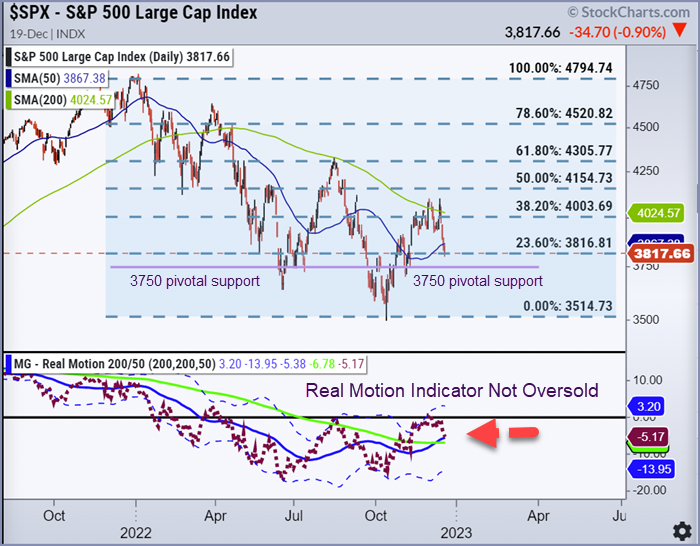
S&P 500 resistance levels to confirm more upside are 3850, 3910, 3930, 3950, and 4,000, and pivotal support levels now are 3800, 3750, and 3500.
3750 is a crucial support area.
Stay alert in this ordinarily quiet holiday trading week and watch price action closely. Know your risk, have tight stops, and take profits when prudent.If you’re interested in learning more about how Real Motion can help you trade with an edge, contact Rob Quinn, our Chief Strategy Consultant, who can provide more information about Mish’s Premium trading service with a complimentary one-on-one consultation
Get your copy of “Plant Your Money Tree: A Guide to Growing Your Wealth”
Grow Your Wealth Today and Plant Your Money Tree!

“I grew my money tree and so can you!”- Mish Schneider
Mish in the Media
Business First AM 12-19-22Best Trade, Worst Trade 2022
Real Vision 12-07-22Another Year, Another Commodities Super-Cycle?
CNBC Asia 12-15-22Tesla, Sugar and Gold – Is Mish Buying?
CMC Markets Mish’s Mid-Week Column12-07-22Two closely watched ETFs could be set to fall further
Business First AM 12-13-22Confusion in the Market
Business First AM 12-07-22Mish Trades VanEck Vietnam ETF
ETF Summary
S&P 500 (SPY) 375 support and 390 resistance
Russell 2000 (IWM) 170 pivotal support and 176 resistance
Dow (DIA) 324 first level of support and 334 first level of resistance. The only index above its 50-WMA.
Nasdaq (QQQ) 265 pivotal support and 276 resistance
Regional banks (KRE) Pivotal support is 53 and resistance 59.
Semiconductors (SMH) Support is 204 and 213 resistance.
Transportation (IYT) 211 pivotal support and 222 is now resistance.
Biotechnology (IBB) 130 was pivotal support and 139 resistance. Closed at 130.56 next level of support 127.Retail (XRT) Closed slightly below 60. 57 pivotal support and 63 is now resistance.
20221220