Following Strength in Financials

Following Strength in Financials
Every week, I run a scan for new three-month highs and three-month lows. Why three months? I have found that it’s a long enough time frame that you’re able to identify stocks that are truly rotating into a more bullish trend. At the same time, you’re able to skip the short-term bounces in charts that are still in long-term downtrends.
This week’s scan (which I shared with Market Misbehavior Premium Members) included a bunch of Energy names (no real surprise there!) but also an increasing number of Financial stocks.
One of the charts behind me in my home office shows US interest rates back to 1915. It shows the steady rise in rates through 1980, then the persistent downtrend in rates until the present day.
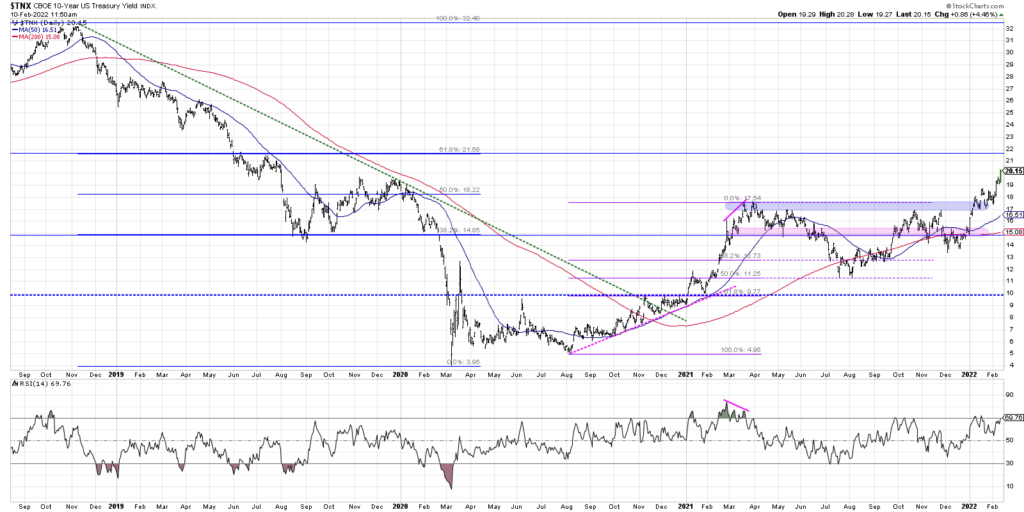
Now that chart is starting to turn higher, with the Ten-Year Treasury Yield breaking above 2% today for the first time since July 2019.

For those of you that have not experienced a rising interest rate environment, here’s what market history will tell you. Rising rates are bad for growth stocks (whose valuations seem less attractive) and good for value stocks, especially banks (whose business is based on the yield curve).
With that as the backdrop, let’s look at one particular chart in the space that came up on my New Three-Month Highs screen.

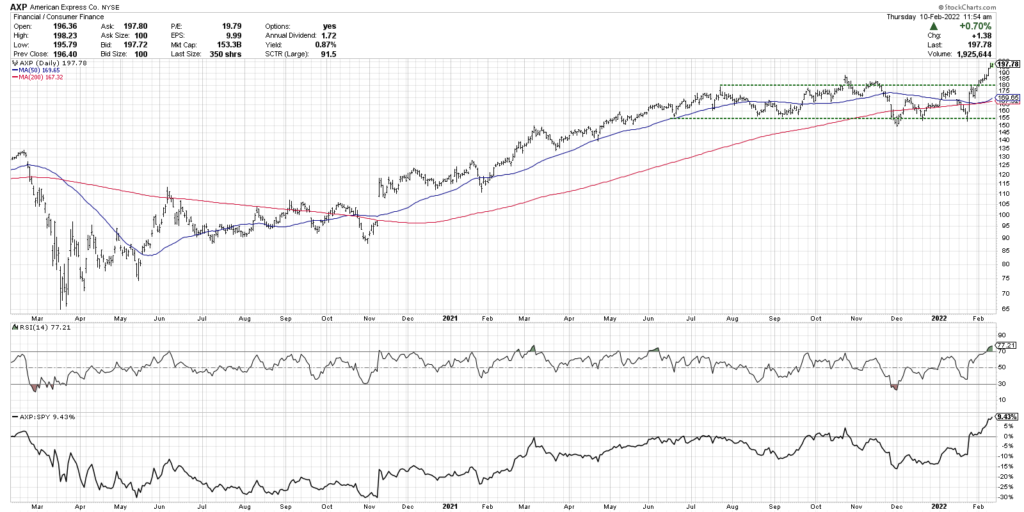
American Express had a strong chart in the first half of 2021, with consistent higher highs and improving relative strength. The price entered a “basing pattern” in July 2021. A basing pattern is basically a consolidation phase with well-established support and resistance levels.
From July 2021 through January 2022, AXP has basically traded between support around $155 and resistance around $175-185. A basing pattern like this essentially illustrates that buyers and sellers are in agreement on the price of the stock, and the price is in an equilibrium
Now look at how the character of this chart changed in February, with the price moving decisively through a resistance level that has held for over six months!
This move to the upside is often called a “big base breakout” and it shows how buying power has emerged to overwhelm any selling pressure. One of the basing measurement techniques in technical analysis is to take the height of the price pattern and then project that as a new upside target.
Using that methodology here, we get to a simple price target of around $205-210. It’s worth noting that we should consider that a minimum upside objective. This means that it’s likely that AXP would reach that target, but it’s no guarantee that the uptrend could continue through that price target.
A quick glance through the StockCharts SCTR rankings in the Financial sector shows other stocks in similar breakout scenarios, including DB, HSBC, LPLA, CMA and ZION.
Higher interest rates should provide a tailwind to the Financial sector, and a review of key charts in the sector will show that breakouts are already starting to emerge.
A mindful investor knows how to combine macro strategy and investment themes with a good bottom-up stock picking process. Follow the breakouts, identify entry points, and manage your risk.
For deeper dives into market awareness, investor psychology and routines, check out my YouTube channel!
RR#6,
Dave
PS- Ready to upgrade your investment process? Check out my free course on behavioral investing!
David Keller, CMT
Chief Market Strategist
https://www.StockCharts.com
David Keller, CMT is Chief Market Strategist at StockCharts.com, where he helps investors minimize behavioral biases through technical analysis of the financial markets. He is also President and Chief Strategist at Sierra Alpha Research LLC, a boutique investment research firm focused on managing risk through market awareness. He is a Past President of the Chartered Market Technician (CMT) Association and currently serves on the CMT Curriculum and Test Committee. David was formerly a Managing Director of Research at Fidelity Investments in Boston as well as a technical analysis of the financial markets specialist for Bloomberg in New York. You can follow his thinking at MarketMisbehavior.com, where he explores the relationship between behavioral psychology and the financial markets.
Disclaimer: This blog is for educational purposes only and should not be construed as financial advice. The ideas and strategies should never be used without first assessing your own personal and financial situation, or without consulting a financial professional.
The author does not have a position in mentioned securities at the time of publication. Any opinions expressed herein are solely those of the author, and do not in any way represent the views or opinions of any other person or entity.
20220210


