Cracking The Code: Navigating Gold’s Confusing Outlook & Oil’s Surge – Technical Analysis DayTradeIdeas

Cracking The Code: Navigating Gold’s Confusing Outlook & Oil’s Surge – Technical Analysis DayTradeIdeas
Daily Technical Analysis is provided by Jason Sen of Day Trade Ideas, who has been day trading since the late 1980’s. Jason has been a contributor of Traders Summit since the beginning. He primarily focuses on providing technical analysis of the financial markets, including stock chart patterns, Forex and Metals setups, and other useful technical analysis.
Join Telegram https://t.me/daytradeideas
Gold remains in a volatile 2 month sideways channel from 1986/88 down to 1900/1895.
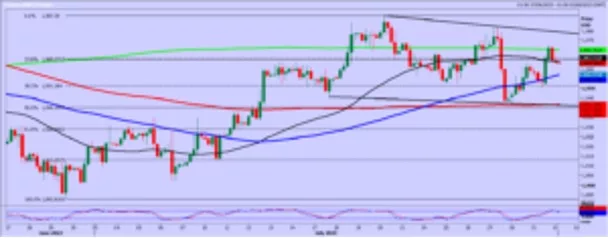
We are just forming a 2 week channel from 1942/40 up to 1976/78.
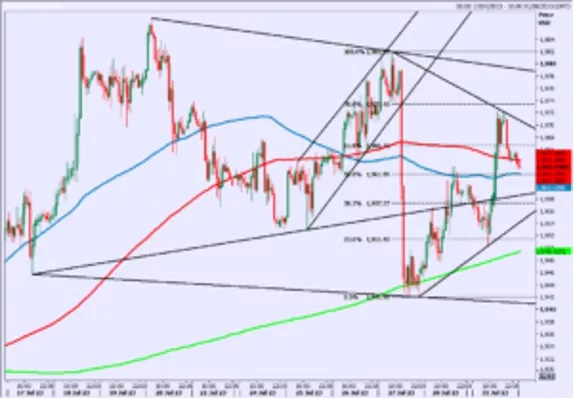
You can see for yourself that the chart is confusing & the weekly chart is no help as we remain in a 3 year sideways channel from 1613 up to 2070/72. We have been $100 higher & $70 lower from this point.
Yesterday we recovered a significant amount of Thursday’s collapse so the bearish engulfing candle did not work as a sell signal. We are trading now where we were at the end of January & beginning of February so we have nowhere in 7 months.
Finding low risk trades within these sideways ranges is becoming more difficult, especially when candle formations are becoming less reliable. This is a market for short term scalpers only. We may have support at 1960/57. Longs here could target 1965, perhaps as far as 1970.
10 day trend line resistance at 1976/78. A break above 1980 however can retest the July high at 1986/87.
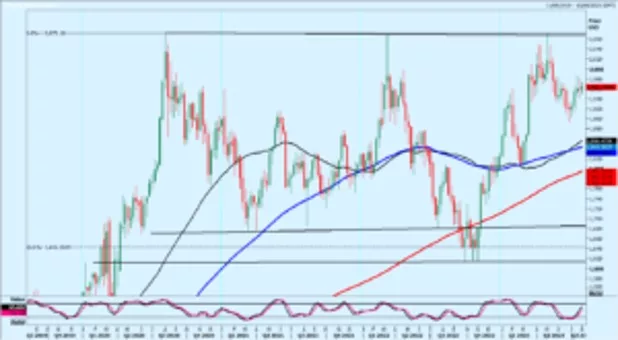
A break below 1955 suggest further losses towards 1950/48, perhaps as far as 2 week trend line support at 1942/40. Longs need stops below 1937. A break lower targets 1930/28. Silver has no trend or pattern to follow from the weekly chart going back to 2020. We are right in the middle of the $12.50 range from 17.50 up to 30.00. The moving averages have flatlined. From this chart we have support at 2260/30 & resistance at 2600/2620.
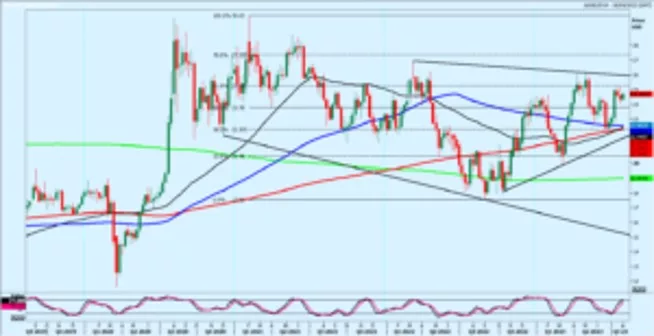
On the daily chart we have tringle as the range narrows over the past 5 months but again the moving averages have flatlined of course. There is some support at 2410/00 but below 2390 can target support at 2300/2280. Resistance at the 3 month trend line at 2500/20. A break above 2525 should be a buy signal.
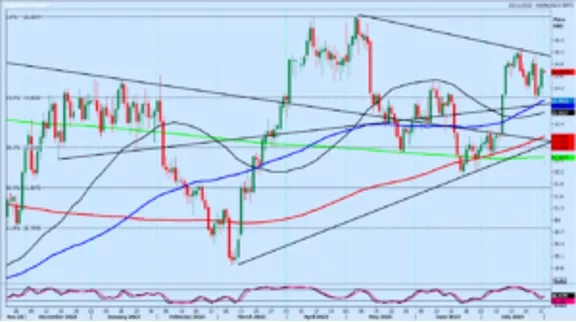
In the short term we have some support at 2410/00. Longs need stops below 2390. Longs can target 2450.
WTI Crude September beat strong resistance at 7700/20 for the next buy signal to hit my targets of 7930/70, 8100/20 & now 8180. As I mentioned in the video, we could accelerate gains at this stage & we appear to be doing so. A break above 8200 today can target 8270 & 8310/20. We are buyers on weakness in the bull trend with minor support at 8080/60 & better support at 7990/70. Longs need stops below 7930.
Please email me if you need this report updated or Whatsapp: +66971910019 – To subscribe to this report please visit daytradeideas.co.uk or email jason@daytradeideas.co.uk
Jason Sen, Director
https://www.daytradeideas.co.uk
20230801


