Alibaba (BABA): a Chart Patterns Review

Chinese tech stocks have been under pressure over the last year or so as traders and investors worry about the influence of Chinese government regulation on company business practice. I noticed a bit of Twitter chatter about Alibaba (BABA) during last week and this got me taking a closer look at its chart patterns and this latest pullback. A couple of traders expressed a new bullish bias for Alibaba and my technical analysis reveals the stock is currently trading near a key Support / Resistance level. The next week or two might decide whether this level can act as effective support to stem this latest decline.
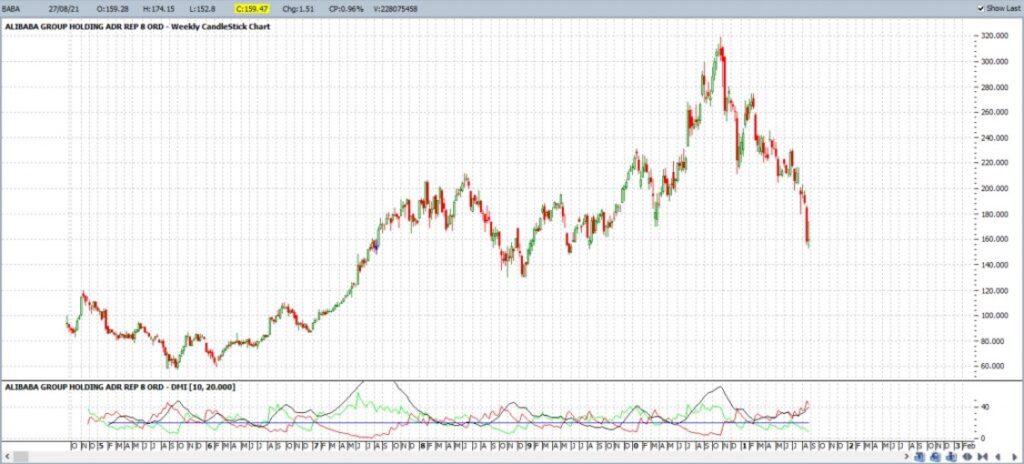
BABA weekly: Alibaba (BABA) listed with an IPO share price of $68 on the NYSE in late 2014. Price action dipped down as low as $60 over the next 18 months but, after spending much of the first two years snaking either side of $80, it eventually cleared this region to trade higher and without much of a backward glance. The share price chopped higher from mid-2016 and peaked at just under $320 ($319.32) in late 2020 before this latest market pullback.
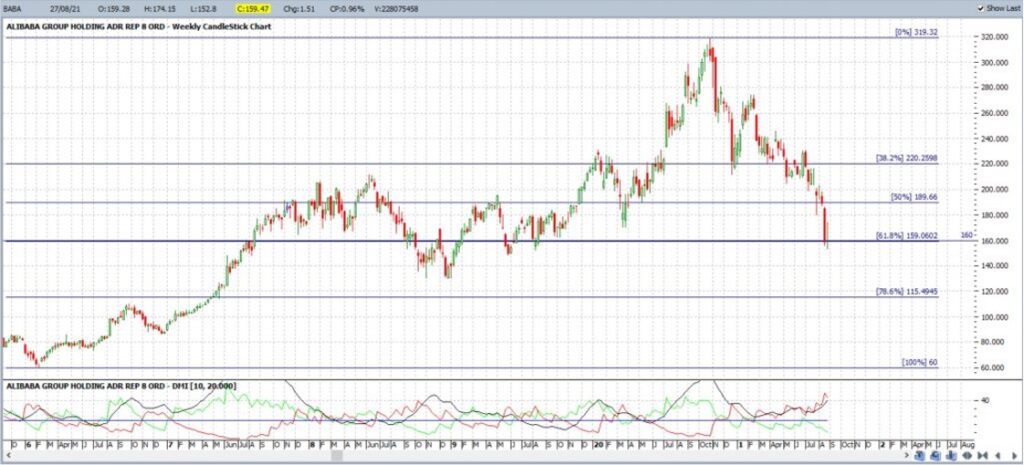
BABA weekly: the chart patterns below shows a Fibonacci retracement tool applied to the 2016 – 2020 swing High move from the $60 Low to the $319.32 High. Note how the share price has pulled back to the 61.8% Fibonacci level, near $160. This particular Fibonacci is a popular retracement level and interested traders can read more about this through the links here, here and here. Suffice to say that many traders and analysts will be watching this $160 level with keen interest over the coming weeks.
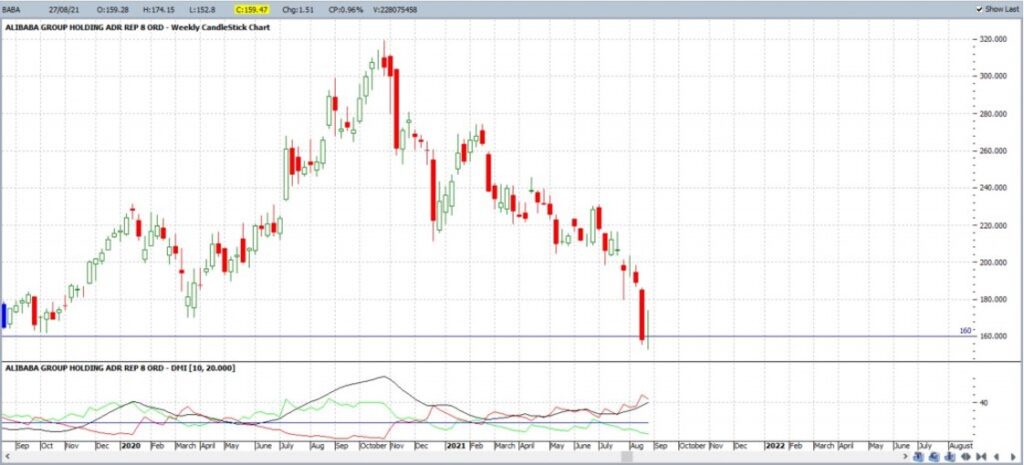
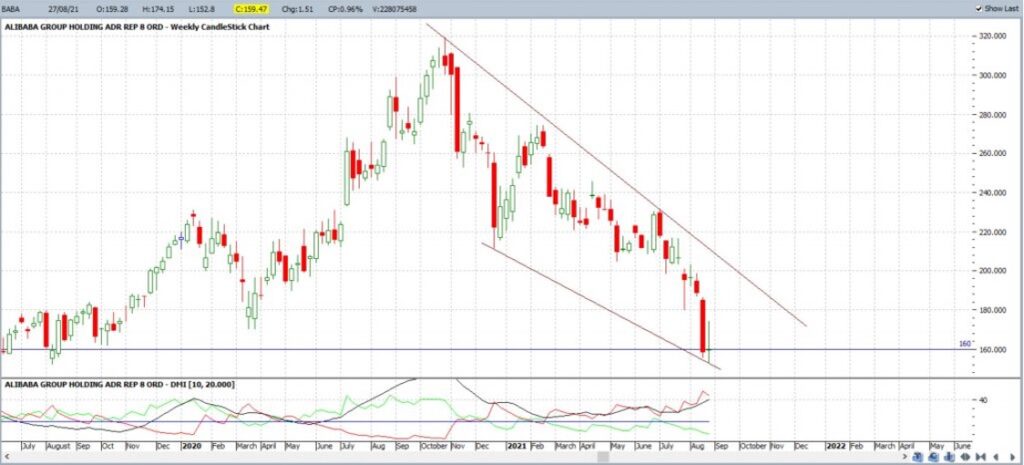
BABA weekly: the chart patterns below shows price action and the recent pullback in greater focus. Notice how the most recent weekly candle closed right near this $160 level as an indecision-style Doji candle.
BABA weekly: the weekly chart patterns below shows this latest swing Low pullback move captured within a Descending Wedge-style pattern. These are typically bullish-reversal patterns and examples of this behaviour can be found through the following link. Any bullish bounce up from the $160 level would bring the upper wedge trend line into focus.
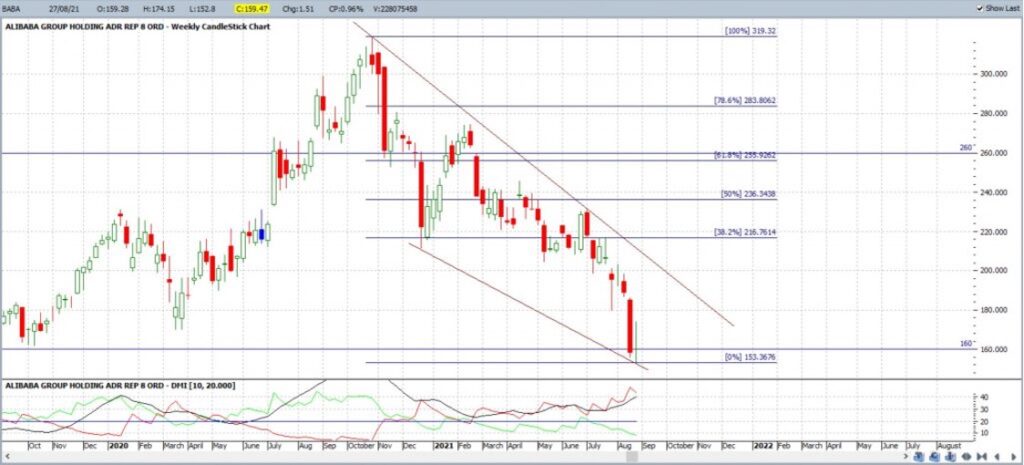
BABA weekly: the weekly chart patterns below has another Fibonacci retracement applied but this one covers the swing Low move from the $319.32 High to the recent Low near $160. This retracement tool has been applied to help identify any potential target; should price action make a bullish breakout from the descending wedge pattern. Examples of the benefit of mapping for 61.8% Fibonacci retracement from bullish descending wedge breakouts can be found through the following links here and here.
The popular 61.8% Fibonacci retracement level, in this case, is currently near the $260 level which seems to be a bit of a reaction zone as well. This would be one potential level to target in the event of a bullish recovery off the $160 and bullish wedge breakout and this would be followed by the 100% retracement level, near $320.
Concluding comments:
Alibaba, like many Chinese tech stocks, has pulled back significantly over the last 11 months. The share price closed last week just below $160 which is the whole-number level very close to the 61.8% Fibonacci retracement of the 2016 – 2020 swing High move. The next couple of weeks will reveal whether this $160 will evolve to be effective support but, if so, then a bullish-reversal descending wedge may be worth monitoring and any bullish wedge breakout would bring $260 into focus as one major target.
About the Author:
Mary is a technical analyst and private trader based In Sydney, Australia and a member of the Australian Technical Analysts Association (ATAA). More information about her analysis and trading style can be found at Tradecharting.com.
Mary McNamara


