The US Dollar Index and European Bond Yields


The US Dollar Index and European Bond Yields
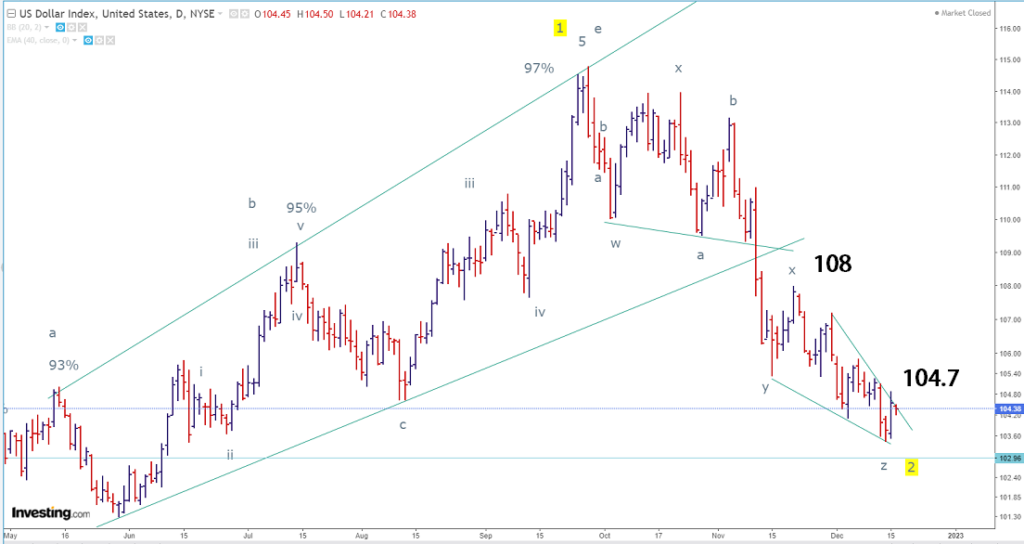
The Dollar Index
Even as we call the final leg of the decline z, the visual is wedge-like on many related asset prices. So a breakout above 104.70 on a closing basis should set us up to move back to 108. That is the high of wave x. Longer term, I would like to think of the five-wave advance as wave 1 or wave A of an ending pattern. We cannot know which one in advance. If the next rally is impulse, it is wave 3; if it is corrective, it is wave C of an ending diagonal. Both options are open on the table. But as of now, at near 104 the risk-reward is favorable for dollar bulls. Remember, the DXY made a double top in the 103-104 range between 2017-2020, and that is now the pullback support as well long term.
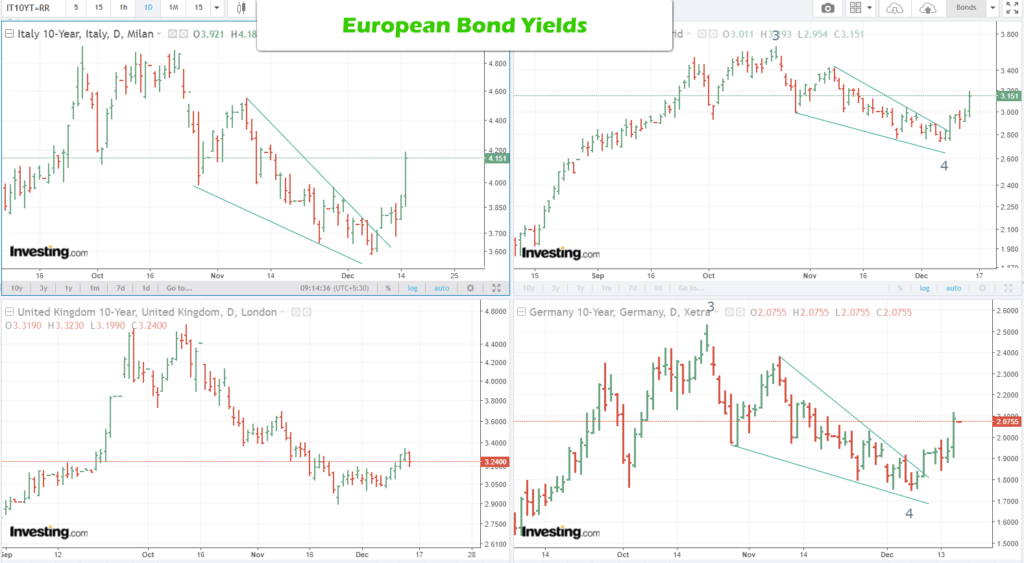
European Bond Yields are Breaking Out
A few days ago, I published a chart of bond yields where triangles were visible in European bond yield charts. They have taken the lead. So this week was less about US and more about Europe. Makes sense. The US took the lead in raising rates, and others are behind the curve. With inflation still near 10% in Europe, it’s catch-up time. The BOE raising rates by 50bps to 3.5% and the ECB sounding hawkish drove the yields in Europe, as seen in the chart below. That is what gave equities the sinking feeling. It’s not just about the FEDs higher for longer but that the entire world is moving toward tighter financial conditions, and clearly, that is not priced into markets. So in the future, weakness in non-US markets could drive the economic trends in global growth.
20221216