The Three Charts That Tell the Story

We are now deeply into the seasonally weakest part of the year, with August in particular being one of the worst months for the S&P 500 index.
I’ve spoken often about the “stealth correction” that the market has been in since April, with the major indexes moving higher driven by a relatively small number of mega cap names. 46% of the S&P 500 stocks remain below their 50-day moving averages, even though the S&P and Nasdaq have continued to make new all-time highs every month!
While the most important chart remains the S&P 500 and its continued upside and predictable pullbacks to the 50-day moving average, here are three key charts I’m watching now to get a read on the current market environment.

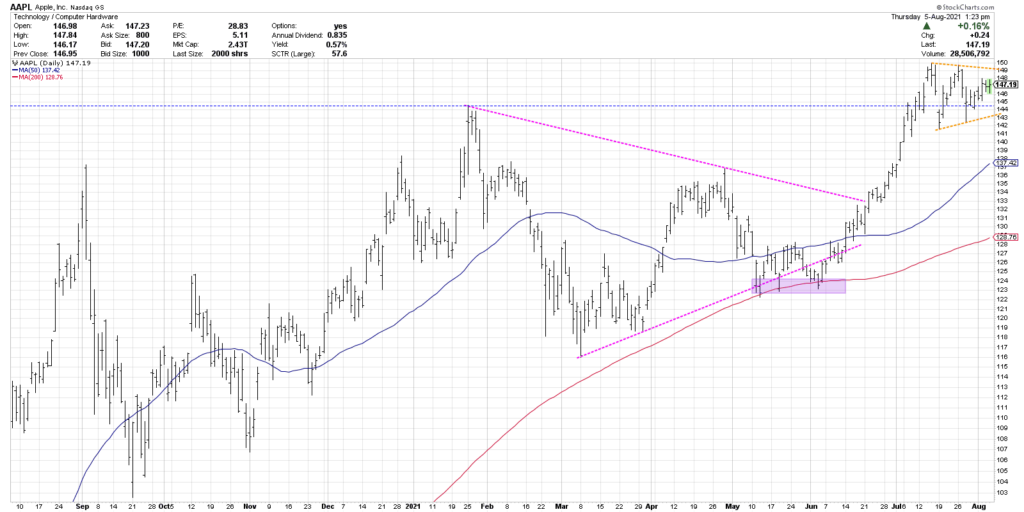
Since the cyclical sectors like financials and energy peaked in April into May, this market has been driven higher by the FAANG stocks. Apple was in a symmetrical triangle pattern for the first six months of 2021 and its breakout to the upside in June was a clear indication of the return of the FAANG trade.
Last month, AAPL broke above its February high, which any Technical Analysis 101 course would tell you is most likely an indication of much further upside potential. But similar to Amazon’s turn lower after breaking out of a base, Apple has now settled into what’s called a pennant formation of lower highs and higher lows.
If AAPL breaks above $150, that would signal an all-clear and suggest further market upside driven by tech and communication names. If AAPL resolves this pattern to the downside, moving below $142, that could indicate more of a broader “risk off” mentality from investors.

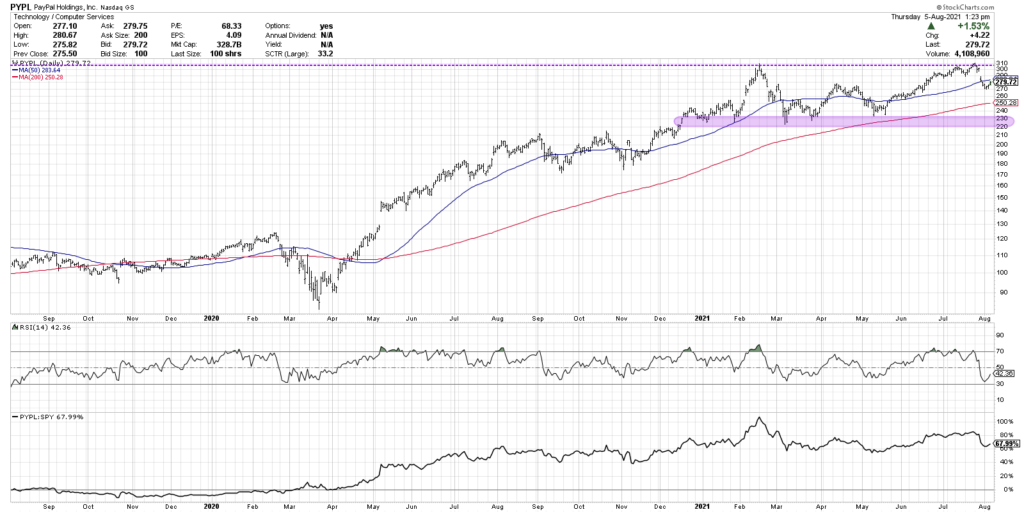
The electronic payments space has been strong over the long-term, although names like PayPal (PYPL) and Square (SQ) have experienced pullbacks in recent months. PYPL could be a good indication of whether there’s enough buying power at work to propel stocks above key resistance levels.
PYPL reached $310 in February before settling into a six-month consolidation pattern. This level was once again tested in July before PayPal pulled back to just below its 50-day moving average. A break above $310 would indicate renewed demand for these stocks and also a broader participation in growth stocks.

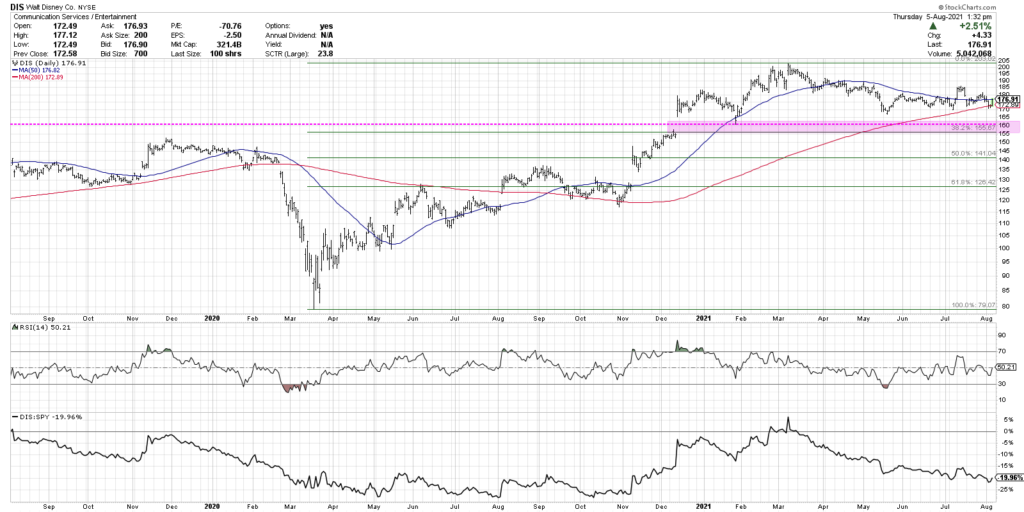
The third chart is a little different than the first two, in that Disney is in a clear short-term downtrend from all-time highs in March. This is one of the many stocks testing their 200-day moving averages.
If this bull market is in good shape, then I would think stocks like DIS should be bouncing off their 200-day moving averages as investors see this as an opportunity to “buy on the dips” and add to positions after a pullback. If charts like this fail at their 200-day, that suggests that buyers are not willing to buy in at these levels, and suggests further downside pressure as investors recognize key support levels are no longer holding as expected.
These are three charts, with three different configurations, which I believe will tell you a great deal about investor psychology as we progress through the seasonally weakest part of the year.
For deeper dives into market awareness, investor psychology and routines, check out my YouTube channel!
RR#6,
Dave
PS- Ready to upgrade your investment process? Check out my free course on behavioral investing!
David Keller, CMT
Chief Market Strategist
https://www.StockCharts.com
David Keller, CMT is Chief Market Strategist at StockCharts.com, where he helps investors minimize behavioral biases through technical analysis. He is also President and Chief Strategist at Sierra Alpha Research LLC, a boutique investment research firm focused on managing risk through market awareness. He is a Past President of the Chartered Market Technician (CMT) Association and currently serves on the CMT Curriculum and Test Committee. David was formerly a Managing Director of Research at Fidelity Investments in Boston as well as a technical analysis specialist for Bloomberg in New York. You can follow his thinking at MarketMisbehavior.com, where he explores the relationship between behavioral psychology and the financial markets.
Disclaimer: This blog is for educational purposes only and should not be construed as financial advice. The ideas and strategies should never be used without first assessing your own personal and financial situation, or without consulting a financial professional.
The author does not have a position in mentioned securities at the time of publication. Any opinions expressed herein are solely those of the author, and do not in any way represent the views or opinions of any other person or entity.


