The Shiller Ratio is Telling Us There is More to Come


The Shiller Ratio is Telling Us There is More to Come
You don’t want to miss Mish’s 2023 Market Outlook E-available now
Written by Michele ‘Mish’ Schneider and Wade Dawson

As earnings season kicks off, the market is primed to witness some surprising turns in the coming days, weeks, and months ahead.
Powell’s speech today kept investors thinking about future interest rate hikes and what that all will mean.
Gold and silver continue to rise as a hedge against inflationary pressures from an increasingly robust labor market alongside continued consumer spending.
Oil is creeping up slowly. Value stocks outperform growth, while the US Dollar is vulnerable.
These data points are monitored continuously, to get a clearer idea of where the market will be in a few months. We also watch similar events unfold and brought a favorite indicator for times like this! Financial professionals watch these factors across markets closely.
The CAPE Ratio Explained
Nobel prize-winning economist Robert Shiller created the cyclically adjusted price-to-earnings (C.A.P.E.) ratio to compile a valuation measure that averages profits over the last ten years, so it takes the stock price divided by a 10-year average of earnings.
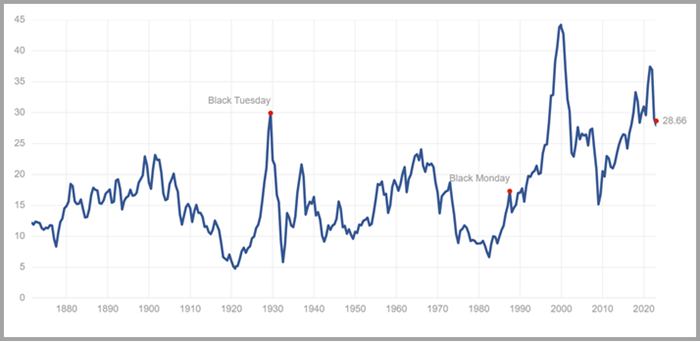
The CAPE Ratio is far from perfect, but it is an interesting measure to judge valuations. For example, shortly before the dot.com bust in 2000, the Schiller Ratio was at 44.
The historical average is 16.7 and on Tuesday, January 9, 2023, the Shiller Ratio was 28.66 similar in prices to 1929.
The price earnings ratio is based on average inflation-adjusted earnings from the previous 10 years, known as the Cyclically Adjusted PE Ratio or (CAPE Ratio).
A simple yet powerful measuring stick that helps identify and analyze trends in the business cycle, equipping those seeking financial gain better insight into potentially inflated market conditions.
Click here if you’d like a complimentary copy of Mish’s 2023 Market Outlook E-Book in your inbox.For more detailed trading information, contact Rob Quinn, our Chief Strategy Consultant, to learn more about Mish’s Premium trading service.
Get your copy of “Plant Your Money Tree: A Guide to Growing Your Wealth”
Grow Your Wealth Today and Plant Your Money Tree!

“I grew my money tree and so can you!”- Mish Schneider
Mish in the Media
Business First AM 01-09-22Inflation Worries WORLDWIDE
Business First AM 12-20-22Mish PICK – Nintendo $NTDOY
StockCharts 12-28-22Catching Big Swings Using Phases, Leadership and Momentum
Business First AM 12-20-22Mish PICK – Nintendo $NTDOY
WOLF Financial Published, 12-20-22Leaving Financial Legacies with Michele Schneider
Business First AM 12-19-22Best Trade, Worst Trade 2022
Real Vision 12-07-22Another Year, Another Commodities Super-Cycle?
CNBC Asia 12-15-22Tesla, Sugar and Gold – Is Mish Buying?
CMC Markets Mish’s Mid-Week Column12-07-22Two closely watched ETFs could be set to fall further
ETF Summary
S&P 500 (SPY) 385 support and 395 resistance
Russell 2000 (IWM) 177 pivotal support and 184 resistance
Dow (DIA) 333 support and 340 resistance
Nasdaq (QQQ) 268 support and 276 resistance
Regional banks (KRE) 56 support and resistance 62.
Semiconductors (SMH) Support is 216 and 223 resistance.
Transportation (IYT) 220 pivotal support and 230 is now resistance.
Biotechnology (IBB) 127 is pivotal support 168 overhead resistance.
Retail (XRT) 60 pivotal support and 66 is now resistance.
20230111