Technical Analysis – DayTradeIdeas


Daily Technical Analysis is provided by Jason Sen of Day Trade Ideas, who has been day trading since the late 1980’s. Jason has been a contributor of Traders Summit since the beginning. He primarily focuses on providing technical analysis of the financial markets, including stock chart patterns, Forex and Metals setups, and other useful technical analysis.
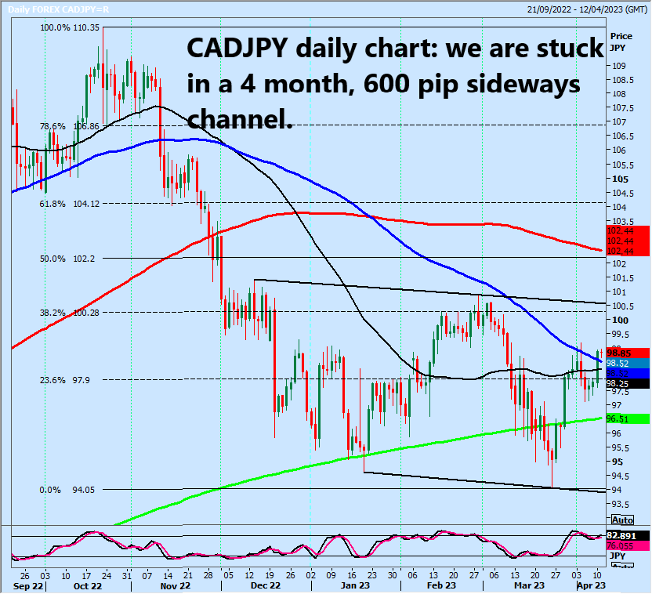
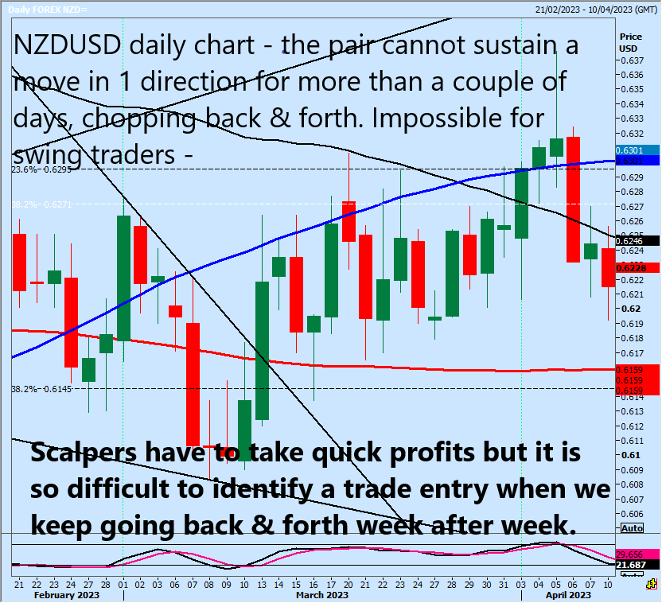
CADJPY longs at the buying opportunity at 9730/10 worked on the bounce to what should have been strong resistance at 9780/90 but we only paused here before we shot higher to retest last week’s high at 9900/05. I still think we should have strong support at 9800/9790 today, but longs need stops below 9775. Looking at the daily chart, we are stuck in a 4 month, 600 pip sideways channel. Note how the 50, 100 & 200 day moving averages are pointing in different directions on the (attached) NZDUSD daily chart as we trade sideways & the averages begin to flat line – a confusing outlook. The same thing is happening on the CADJPY daily chart.
NZDUSD will run higher for up to 100 pips & then collapse just as quickly 7 wipe out the whole gain as we trade in an erratic & volatile sideways trend for a month – looking at the daily chart we are up for a day or 2, then down the for a day or 2.
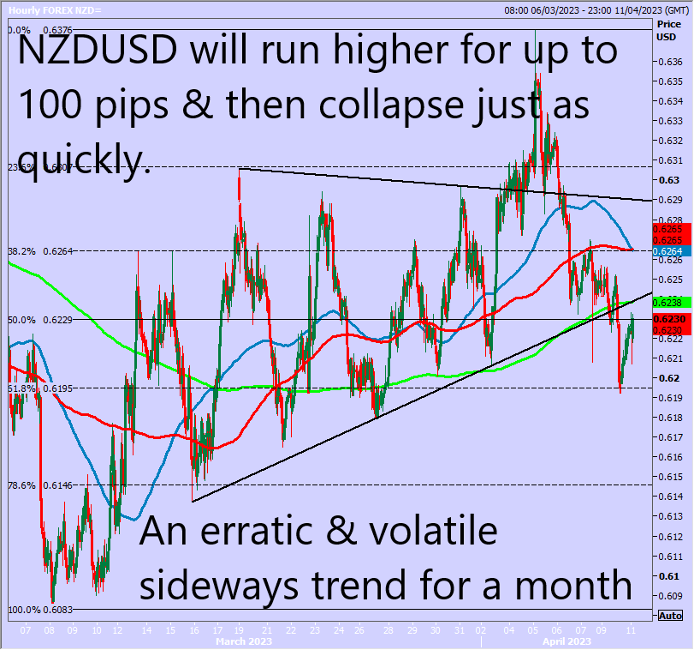
We could have strong resistance at 6240/60.
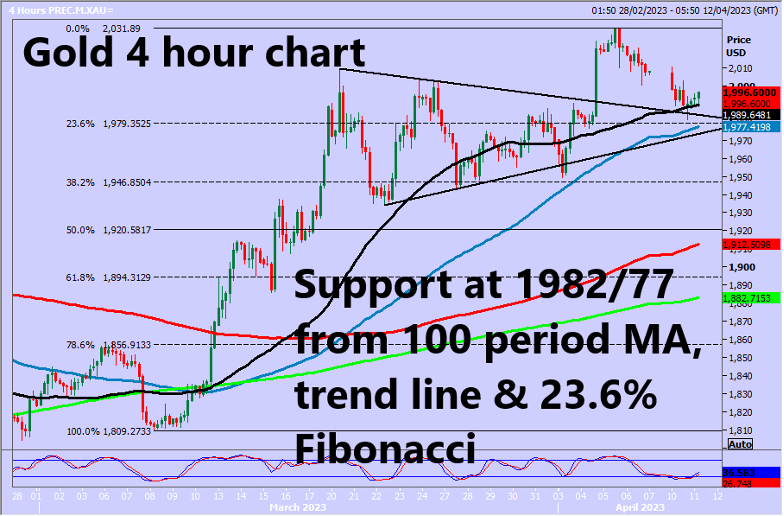
Gold broke the best support for the day at 1998/95 as we enter a small correction to hit the next target of 1982/79. A low for the day exactly here. The 1982/77 area should be very strong support (although I have been surprised how we did not manage to hold the 2 higher support levels).
Longs at 1982/77 stop below 1973. A break lower can target 1960/58. Targets for longs are 1996/98 & above 2000 look for 2010/12. We are in a bull trend so if we continue higher look for 2020 before a retest of 2030/31.
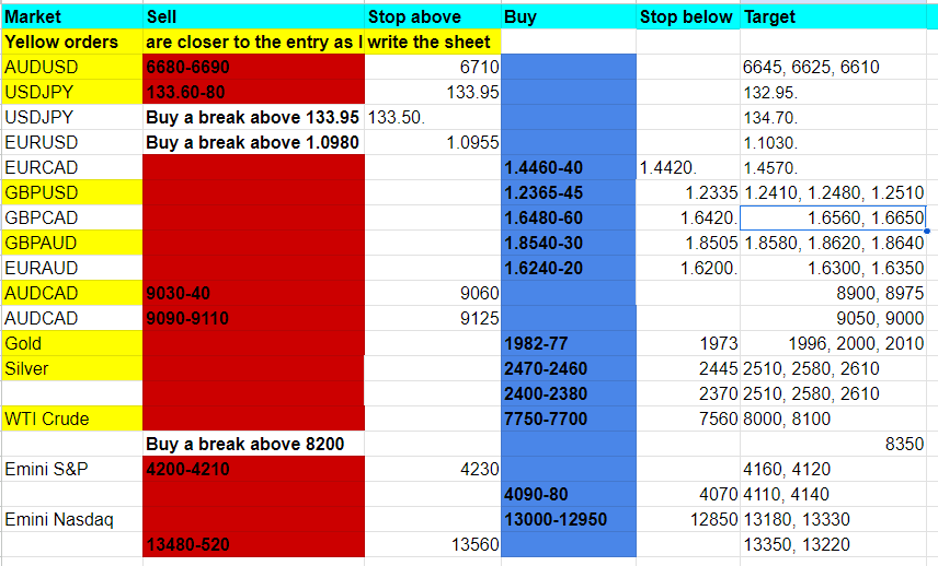
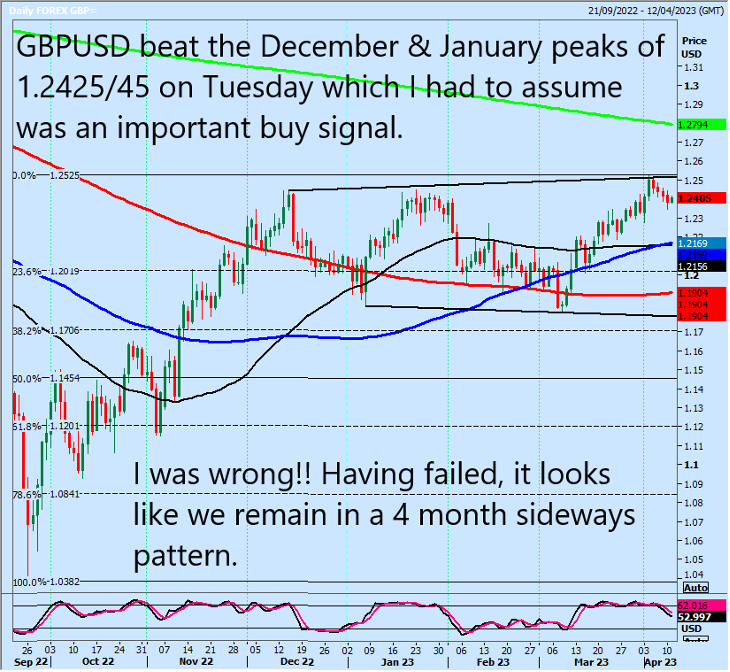
GBPUSD beat the December & January peaks of 1.2425/45 on Tuesday which I had to assume was an important buy signal. I was wrong!! Having failed, it looks like we remain in a 4 month sideways pattern. The pair should have support at 1.2365/45. Longs need stops below 1.2335. A break lower can target 1.2300 & 1.2250.
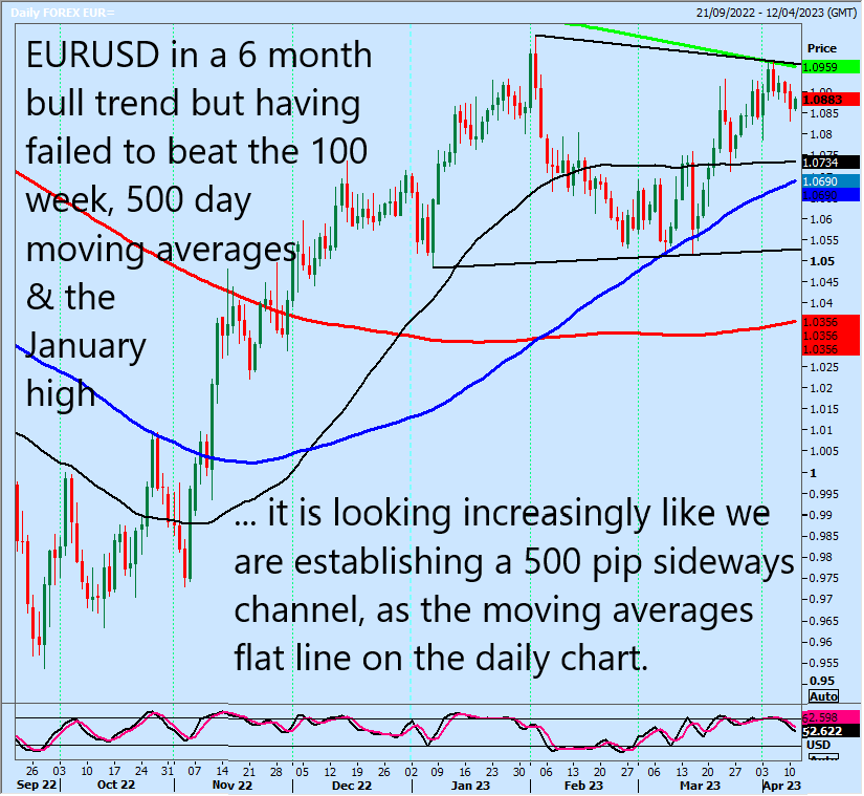
EURUSD broke strong support at 1.0875/55 & traded down to 1.0830. Everything hinges on tomorrow’s US CPI release. The pair is in a 6 month bull trend but having failed to beat the 100 week, 500 day moving averages & the January high it is looking increasingly like we are establishing a 500 pip sideways channel as the moving averages flat line on the daily chart.
Today we could have resistance at the 100 & 200 hour moving averages at 1.0890/1.0900. A break above 1.0920 however can target 1.0935, perhaps as far as 1.0970. Failure to beat 1.0890/1.0900 targets 1.0840/30 then 1.0805/1.0795.
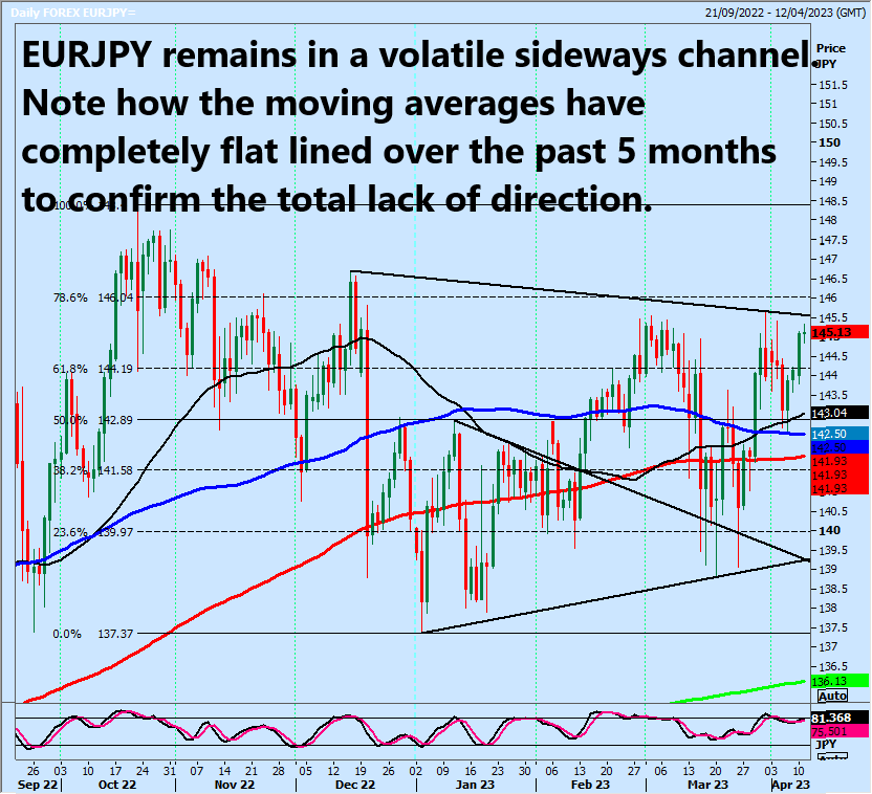
EURJPY remains in a volatile sideways channel, from the lower trend line at 139.50/139.00 up to the upper trend line at 145.30/50. We are about to test this resistance – shorts need stops above 145.75. A break higher therefore SHOULD be a buy signal targeting 146.00/10 & December high at 146.70/72. Note how the moving averages have completely flat lined over the past 5 months to confirm the total lack of direction. No other pattern to guide us.
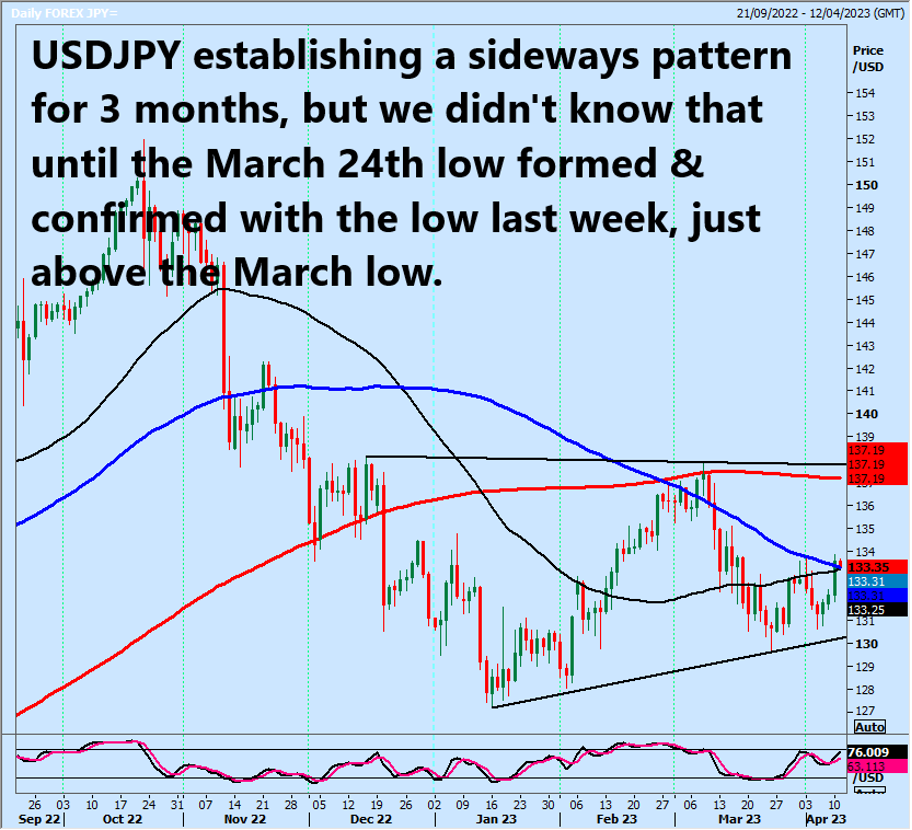
USDJPY has been establishing a sideways pattern for 3 months, but we did not know that until the March 24th low was established & confirmed with the low last week just above the March low. We should have resistance at 133.60/80 today. A break above 133.90 should therefore be a buy signal targeting 134.70/80.
Please email me if you need this report updated or Whatsapp: +66971910019 – To subscribe to this report please visit daytradeideas.co.uk or email jason@daytradeideas.co.uk
Jason Sen, Director
https://www.daytradeideas.co.uk
20230411