Technical Analysis – DayTradeIdeas


Daily Technical Analysis is provided by Jason Sen of Day Trade Ideas, who has been day trading since the late 1980’s. Jason has been a contributor of Traders Summit since the beginning. He primarily focuses on providing technical analysis of the financial markets, including stock chart patterns, Forex and Metals setups, and other useful technical analysis.
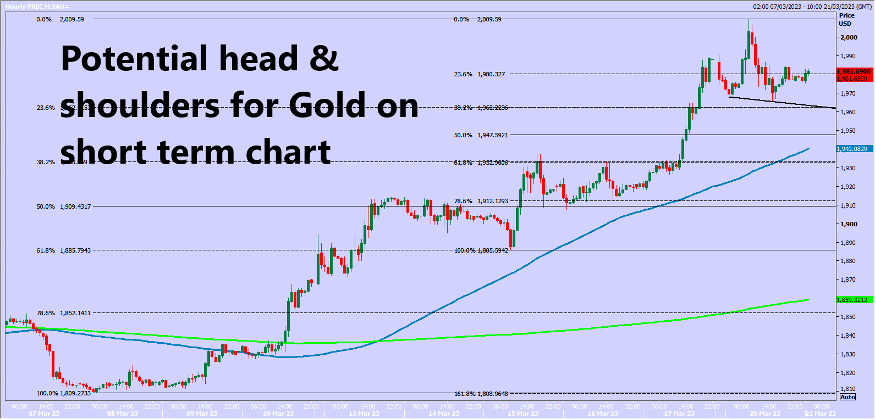
Gold higher again initially to reach 2009. There is a good chance that the gold rally just ended & we even have a potential head & shoulders on the 1 hour chart, with neck line at 1964/60.
Silver beat resistance at 2210/20 for a buy signal, reaching 2271, not quite as far as very strong resistance at 2295/2305. WTI Crude JUNE retested strong support again at 6550/6450. A low for the day exactly here.

Update daily by 05:00 GMT.
Today’s Analysis.
Gold recovers all of February’s steep losses in a V shaped recovery as we hit the next target of 1997/99 & just 3 points from 2012/14. HOWEVER Gold closed slightly down on the day after making the new high for 2023 & could be forming a negative short term head & shoulders pattern. Yesterday we just held support at 1975/75.
Key support today at 1964/60. Longs need stops below 1957. A break lower sees 1962/64 act as resistance targeting 1949/47, perhaps as far as support at 1934/30 for profit taking on shorts.
Minor resistance at 1990/94 but above here can retest 2007/2010. A break higher targets 2012/14, perhaps as far as 2027/29. Silver beat resistance at 2210/20 & held 29 ticks from very strong resistance at 2295/2305. I am revising this resistance down to 2280/2300. Shorts need stops above 2315. A break higher is a buy signal initially targeting 2340/45.
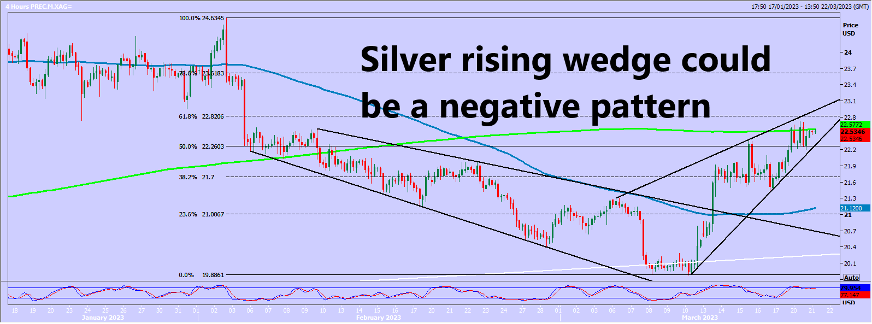
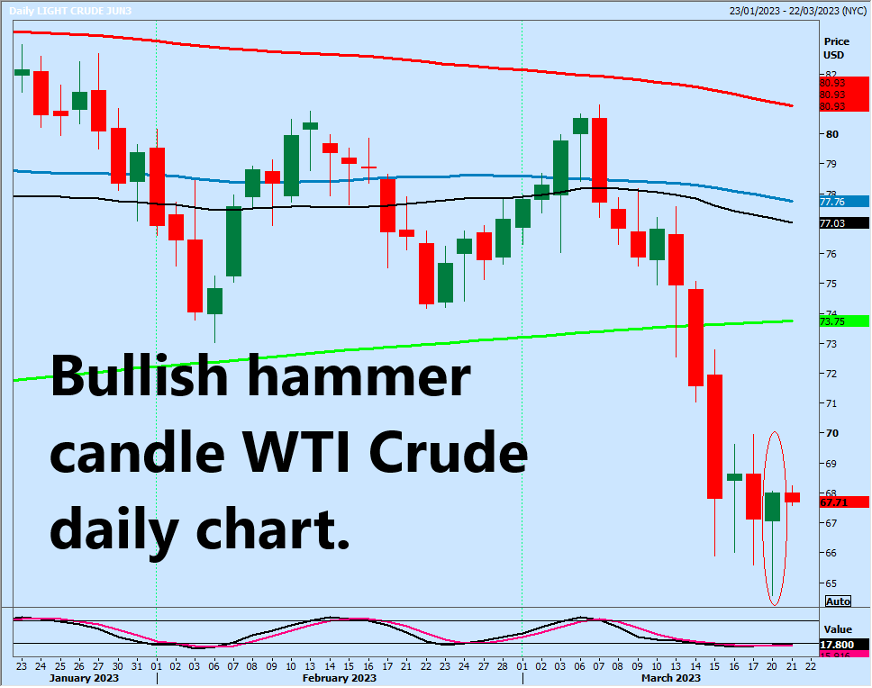
First support at 2245/35. Longs need stops below 2225. A break lower targets support at 2210/00. Longs need stops below 2190. A break lower is a sell signal targeting 2170/60. A break below 2150 targets 2130/25. WTI Crude made a low for the day exactly at strong support again at 6550/6450, leaving a bullish hammer candle on the daily chart so I hope this is now the start of the WTI Crude recovery I have been predicting.
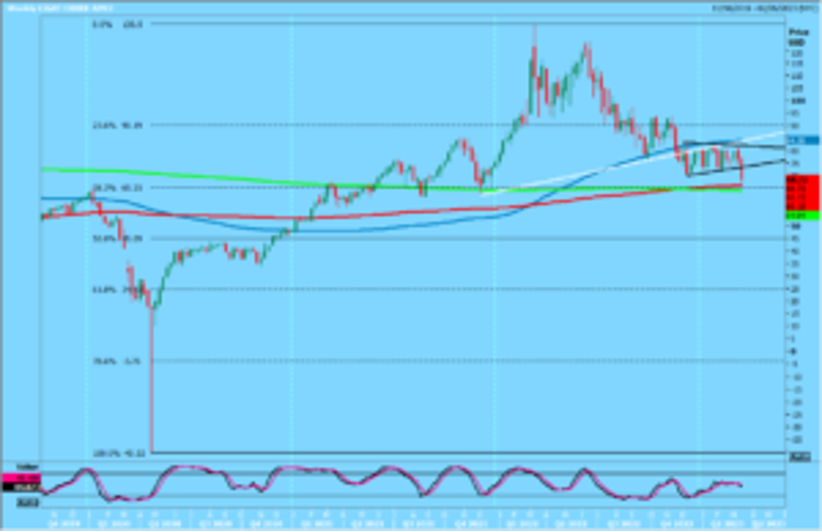
We should have strong support again at 6550/6450. Longs need stops below 6350. A break lower is a sell signal & can target 6200/6150.
Longs at strong support again at 6550/6450 saw a bounce to resistance at 6825/75 fore the June contract. This is key to direction today. If you try a short, stop above 6900. A break higher is an important buy signal targeting 6990 & 7050/7100.
Please email me if you need this report updated or Whatsapp: +66971910019 – To subscribe to this report please visit daytradeideas.co.uk or email jason@daytradeideas.co.uk
Jason Sen, Director
https://www.daytradeideas.co.uk
20230321