Technical Analysis – DayTradeIdeas


Daily Technical Analysis is provided by Jason Sen of Day Trade Ideas, who has been day trading since the late 1980’s. Jason has been a contributor of Traders Summit since the beginning. He primarily focuses on providing technical analysis of the financial markets, including stock chart patterns, Forex and Metals setups, and other useful technical analysis.
Dax 40 March broke higher to the next target of 15710/740 with a high for the day exactly here. We then hit some profit taking & tumbled to what should be minor support at 15470/430.
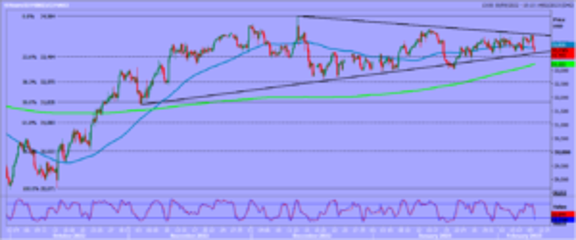
FTSE 100 March continues to push higher with a new all time high at 7915, but we are finding resistance at the 5 month trend line.
Remember when support is broken it usually acts as resistance & vice-versa.
Update daily by 06:00 GMT.
Today’s Analysis.
Dax March held 5 ticks below the next target of 15710/740. We should find support at 15470/430 today. A break below 15390 therefore is a sell signal targeting 15290/260. We should at least pause here but longs may be risky. Further losses eventually can target 15190/170.
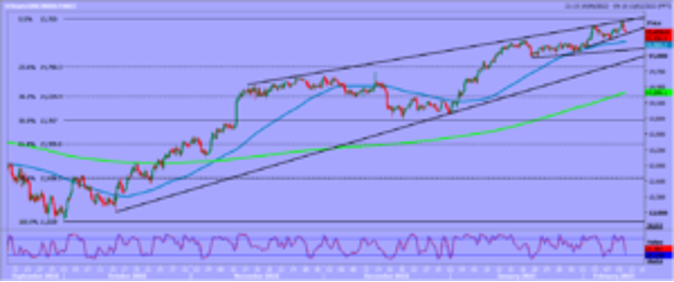
First resistance at 15700/740. Shorts need stops above 15770. A break higher can target 15900/950.
FTSE March longs at first support at 7800/7770 worked perfectly after the buy signal targeting the January high at 7850/60 & the all time high of 7875/85 then as far as 7915 yesterday, leaving a second minor negative shooting star candle. It’s a warning to bulls rather than a sell signal, but there is obviously the risk that the mother of all double top patterns forms if this level holds.
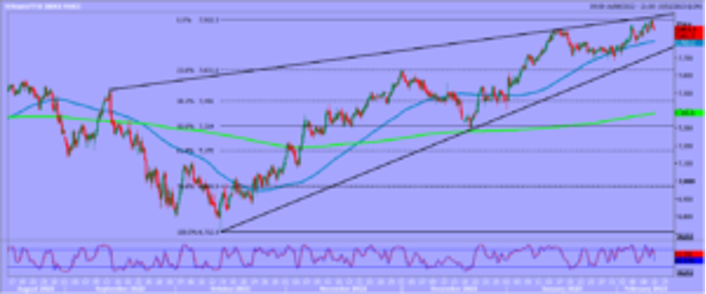
A break higher meets that trend line resistance at 7935/55.
A low for the day exactly at minor support at 7853/50, but expect better support at 7820/10 so watch for a low for the day here. Longs need stops below 7790. A break lower can target 7760/50.
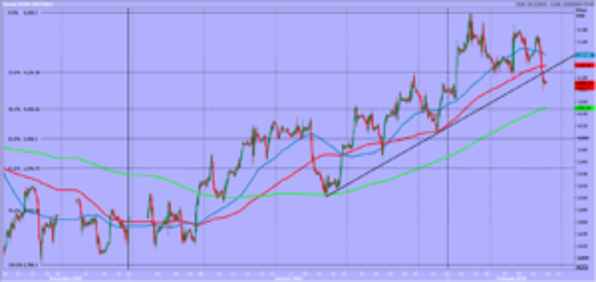
Emini S&P March breaks support at 4120/10 for a sell signal targeting strong support at 4050/40.
Nasdaq March dipped towards best support at 12450/400, holding just above 12500 as we range trade this week.
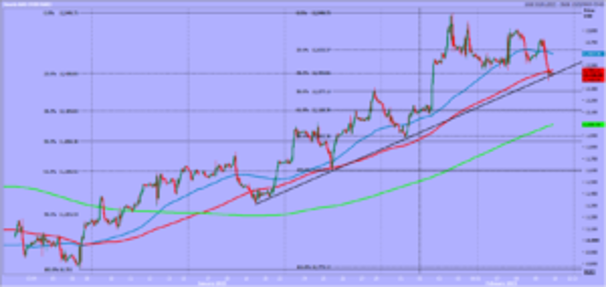
Emini Dow Jones March clearly in a sideways triangle pattern for 2 months. Get ready for the breakout!
Update daily by 06:00 GMT.
Today’s Analysis.
Emini S&P March holding strong resistance at 4195/4210 & but broke first support at 4120/10 this time for a sell signal targeting strong support at 4050/40. Longs need stops below 4030. A weekly close below here would be a short term sell signal for the start of next week.
First resistance at 4105/15. Shorts need stops above 4125. A break higher however can re-target 4160/65 before a retest of strong resistance at 4195/4210. Obviously bulls need a break above 4230 for a buy signal this week.
Nasdaq March drifts towards best support again at 12450/400. Longs need stops below 12350 (with a low for the day yesterday at 12366, keeping us long over night). A break lower today however targets 12300/250 then 12130/100 for profit taking on shorts.
Longs at best support at 12450/400 can target 12600/650, perhaps as far as key resistance at 12850/950. A break above 13000 is a buy signal this week initially targeting 13200/220.
Emini Dow Jones first resistance at the January high at 34450/490. A break above here is a buy signal & can target 34650/700, perhaps as far as the December high at 34930/980.
Strong support at 33600/500. Longs need stops below 33400. A break lower is a sell signal targeting 33000/32950.
Please email me if you need this report updated or Whatsapp: +66971910019 – To subscribe to this report please visit daytradeideas.co.uk or email jason@daytradeideas.co.uk
Jason Sen, Director
https://www.daytradeideas.co.uk
20230210