Steno Signals – The Energy Cable #1

“The Energy Cable #1“
Price signals are starting to look increasingly bearish in oil and natural gas, in particular in Europe. Is the crisis abating? Or is it calm before the storm next winter? Follow us to learn more!
“Nobody gets beyond a petroleum economy. Not while there’s petroleum there.” – Dan Simmons, Hyperion
This is the first edition of “The Energy Cable” written by Warren Pies (3Fourteen Research) and Andreas Steno (Steno Research) with unique insights into Global, US and European energy markets. Energy is a theme that you need to stay on top of through 2023 as regional issues quickly turn into global problems, as we have experienced over and over in 2022.
This is the ONLY letter that stays on top of all the regional issues on both sides of the pond with actionable price signals in oil, natural gas and electricity markets. Enjoy this first edition for free, but as of next Monday, we are going to release “The Energy Cable” behind a cheap paywall. Choose the annual subscription ($199) today to secure a discount of 33% relative to the monthly pricing.

A sneak peek in to the Oil Model from 3Fourteen Research
Recall 2020. Oil prices were negative, “Green Energy” stocks were surging and the Energy Sector’s share of the S&P 500 fell to less than 2%. The world had decided that hydrocarbons were a relic of the “old” economy. Only two-years later, oil was surging (~$140/bbl), Europe was scrambling to secure new hydrocarbons for the winter, and the Energy Sector was up 50% for the year while every other Sector was down.
Cycles may change, but human nature remains the same. Traditional energy has moved from an afterthought to the most important piece of the global macro puzzle. In the current environment, it is impossible to understand inflation data, Fed policy, or portfolio construction without a clear view of the global oil and gas markets.
Against this backdrop, Andreas and I decided it was time to create the first, and only, transatlantic energy collaboration. Each week, we will deliver our view of the energy markets…him from a European perspective and me from a N. American perspective.
I have spent my career in the institutional research space, first as the head of commodities at Ned Davis Research and now as Co-Founder and Strategist at 3Fourteen Research. Over these years, my clients have been large asset managers, hedge funds, and family offices. Through the Energy Cable, I hope to introduce 3Fourteen Research’s methodology to a wider audience.
At 3Fourteen, we approach all markets from a data-driven and quantitative perspective. We prefer models over opinions. A model-driven approach helps neutralize the emotions of investing and avoid the trap of our ego wrapping into our predictions. Thus, each week, we will delve into the oil markets by examining where the 3Fourteen Core Crude Oil Model currently stands (chart below).
Chart 1: 3Fourteen Research oil model back test and performance
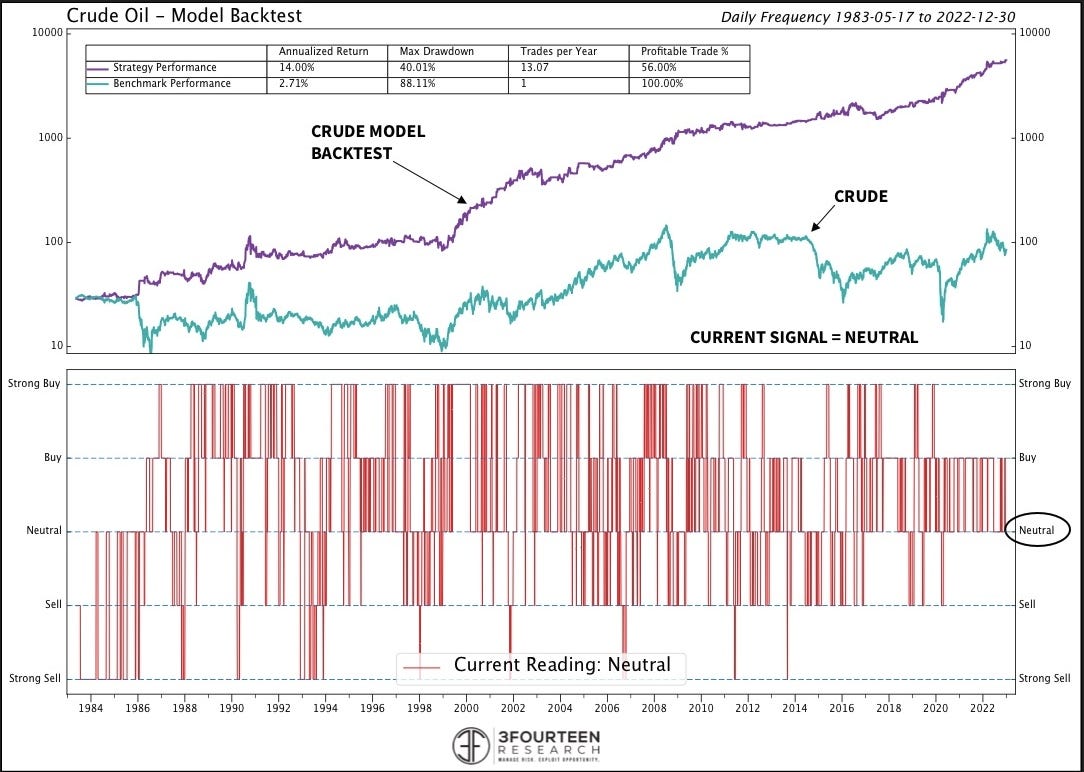
While oil was roughly flat for 2022, the Model’s signals produced a +36% return. One of 3Fourteen’s research principles is that we build conviction with fundamentals but manage risk with technicals. Thus, our Core Crude Oil Model combines a mix of fundamental and technical indicators into one final BUY, NEUTRAL, or SELL signal.
Under the surface, we group the Model’s indicators into four buckets:
· Inventories,
· Physical Market,
· Positioning, &
· Technicals.
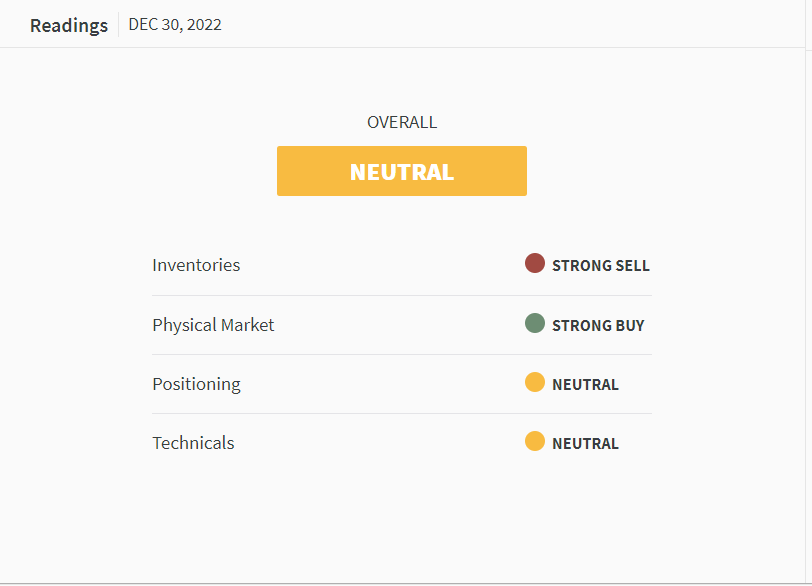
Below, I display the Model’s current reading for each of these four components. To familiarize you with our approach, let’s briefly walk through each component and how we view its role in the global oil market.
Chart 2: Readings in 3Fourteen Researchs oil model
INVENTORIES
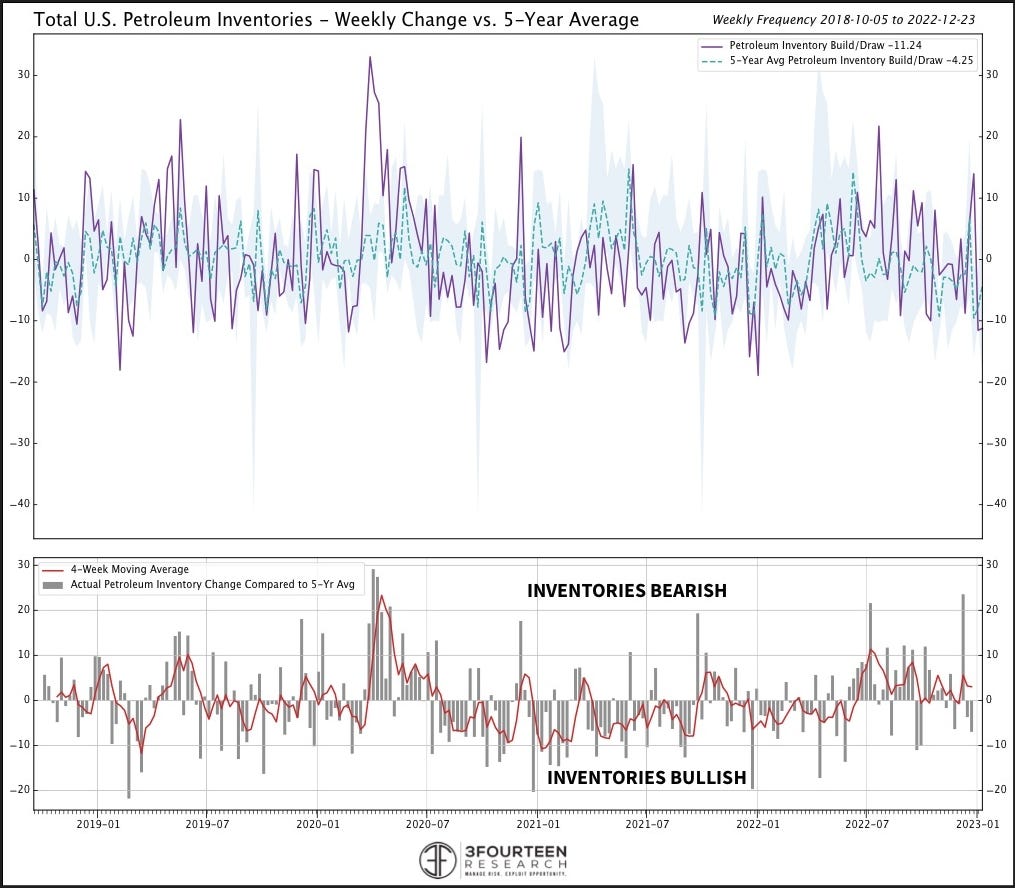
At any given time, a wide-array of factors influence the price of oil. Currencies, geopolitics, economic strength (or weakness) can all sway the market. Cutting through the noise, inventories stand at the center of all relevant crosscurrents. As the balancing point for supply and demand, they are oil’s fundamental scoreboard. At present, the Model reads the inventory situation as bearish. U.S. weekly inventory data remains the highest frequency and cleanest set in the petroleum context. After a long period of consistently bullish readings, total petroleum inventories (oil + refined product) have slipped into bearish territory (chart below).
Chart 3: Total Petroleum inventories in the U.S. vs 5-year average
PHYSICAL MARKET
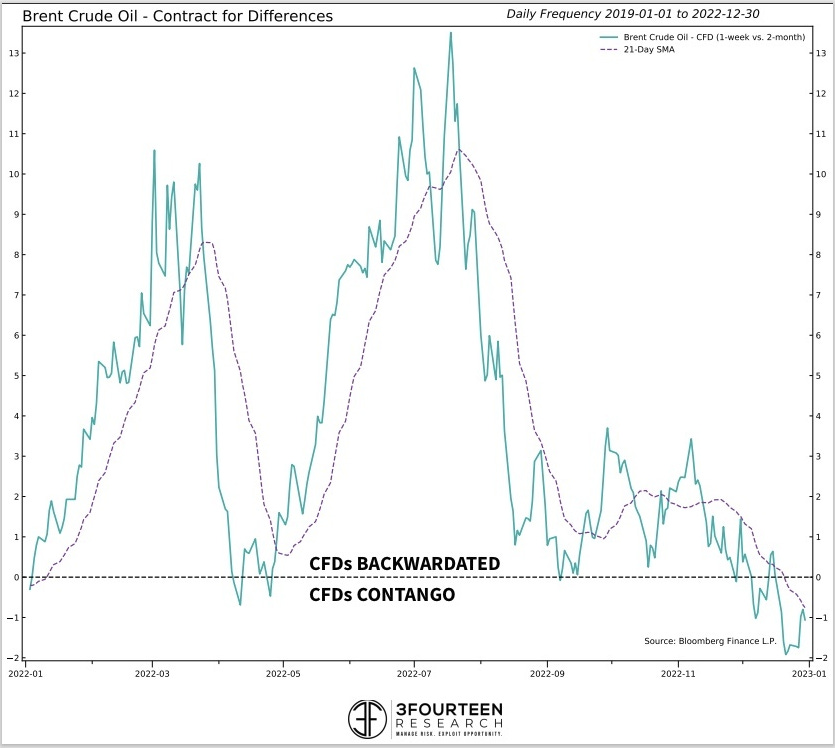
Unlike many financial assets, crude oil is tied to a true physical market. Speculators can bid the price up or push it down, but, ultimately, the physical market will anchor oil back to reality. Within the Model, we gauge the physical market measuring term structure (chart below), refining margins, and key differentials. For now, the physical market component leans bullish. However, we have witnessed consistent weakening for months.
Chart 4: Brent Crude Oil – Contract for Differences now in contango
POSITIONING
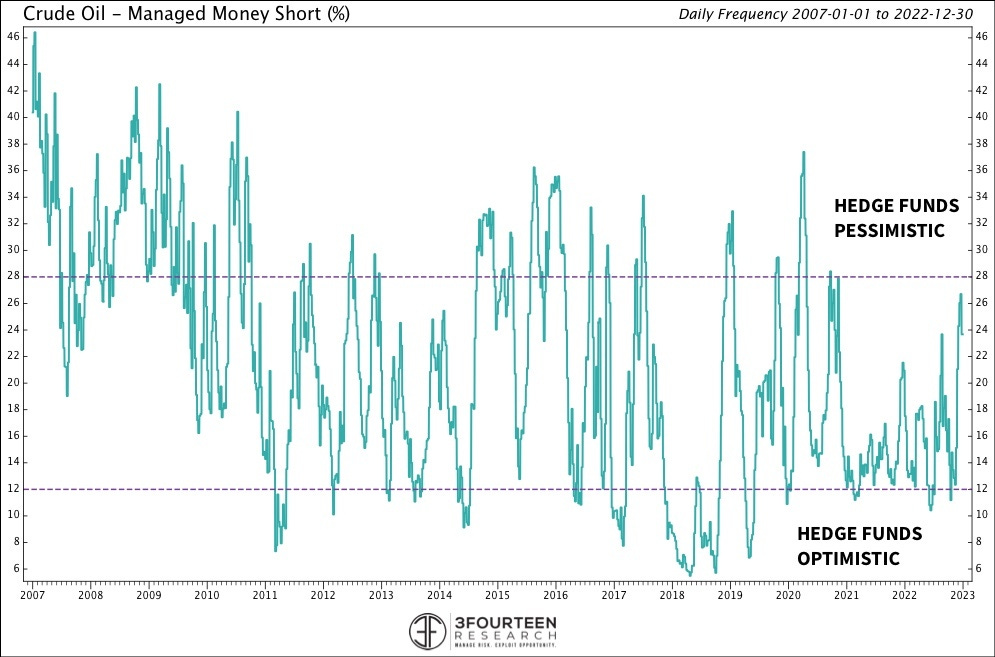
On a long-term horizon, oil price cannot divorce from the physical market reality. However, in the short-term speculators and their jockeying within the paper market massively impact the price of oil. Within the Model, we focus on positioning from a number of angles. Of late, hedge funds have once again swung back to a more pessimistic stance (i.e. adding shorts and closing longs). Fading hedge funds and CTAs at extremes has been a consistently profitable strategy. For now, the Model reads positioning as neutral, but current positioning is closer to extreme pessimism than optimism (chart below).
Chart 5: CFTC Managed Money Short positioning as % of open interest
TECHNICALS
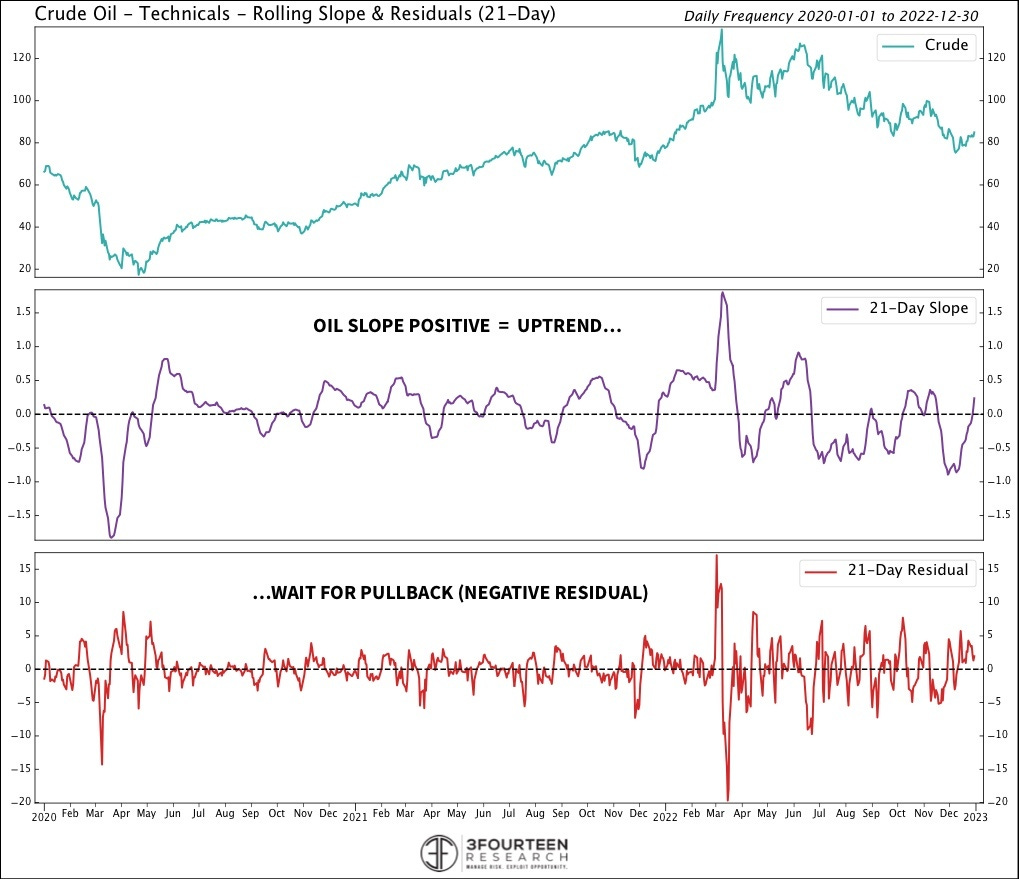
Technical indicators make up the Model’s final component. As I said, price action is key to risk management. However, many traditional technical tools used in other markets do not map onto oil. In the weeks ahead, I will take you through a systematic approach to oil’s key technical indicators. Below, I highlight one technical strategy our Model considers. Here, we calculate oil’s short-term trend via a regression trendline slope (positive = uptrend). This indicator looks for pullbacks (negative residual, bottom clip of chart) within uptrends (positive slope, middle clip). For now, the Model reads the Technical picture as neutral.
Chart 6: Crude oil Technicals – rolling slope & residuals (21-day)
Beginning next week, I will explore the oil and energy markets through the lens of the Core Crude Oil Model and its underlying indicators. Of course, I will also provide my editorial comments and dig into critical topics as they arise. Over time, I will discuss oil price outlook, quantitative modeling tips as applied to oil, Energy Sector trends, and favorable/unfavorable Energy sub-industry selection. Through this process, and my collaboration with Andreas, I believe you will learn more about the global energy markets – what truly drives them – and how to separate signal from noise.
A look at European Natural Gas models from Steno Research
I (Andreas) also hope you have a great start to the new year. In some German cities temperatures reached 20 degrees celsius and people were seen sunbathing in parks.
That’s a pretty stark contrast to the scare campaigns launched by Russia last fall warning us of extreme cold.
Chart 7: Front end NatGas futures have been dropping like a stone!

The warmer than usual weather all around Europe during the last 2-3 weeks has led to a massive drop in the front end of the natural gas future curve. In the beginning of December the first 4 contracts traded around 140 EUR and as of the second of January that number is a tad below 80 EUR.
Chart 8: Germany have been building storages through late December
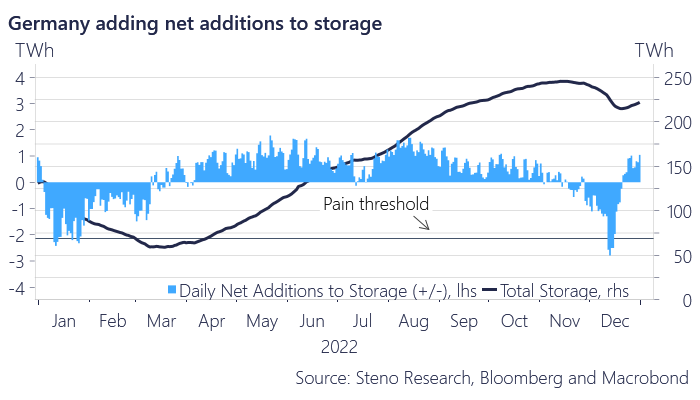
On the back of the warmer than expected weather European countries have seen daily net additions to their natural gas storages, which is very unusual this time of the year. This is great news for Europe since we have to fill up our storages this year without Russian gas and any break to the storage usage is welcomed.
If we take the latest monthly net in/outflow as a gauge, Germany would not run out of Gas until August 2023. This is obviously mostly a theoretical exercise, but it goes to show that this winter is 100% safe unless a bizarre/extraordinary cold snap arrives in January/February.
Chart 9: German Nat Gas flow data suggests that everything is fine for this heating season
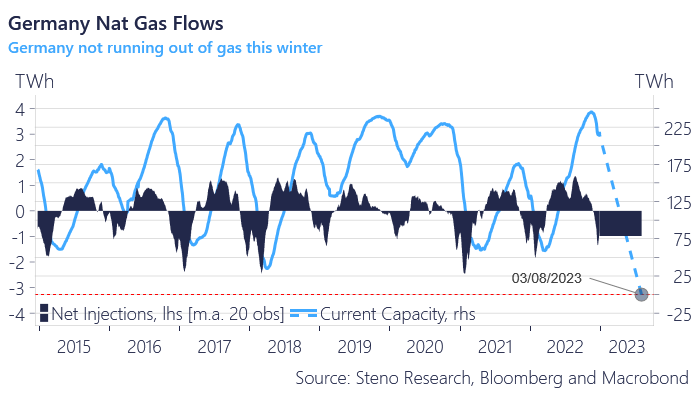
One thing is the absolute levels of storages, but another thing is the momentum in storages relative to comparable seasons in former years. We know that financialized commodity markets price things out of 1) nominal storages and 2) momentum / rate of change relative to a base case, which is why we need to stay on top of both absolute and relative developments in storages.
Chart 10: Europe is in a better spot than 12 months ago
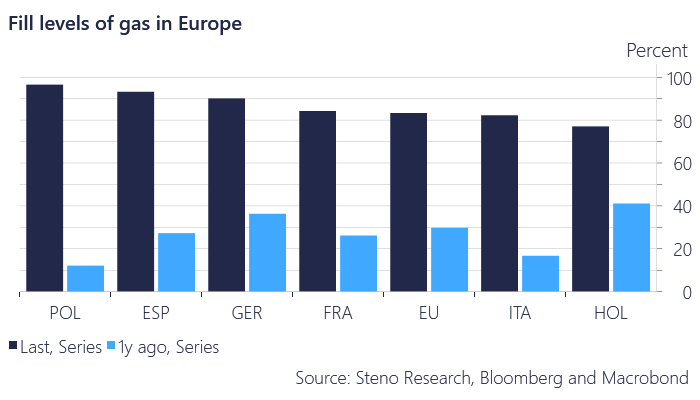
When comparing the Natural Gas storages Europe wide with the levels from exactly a year ago, we can see just how different the situation is today. Storages are in good shape heading into 2023, also from a momentum perspective. This means the world to price action and our natural gas model, which includes storage momentum as one out of three parameters, points to a further slide in prices over the medium-term.
Chart 11: Medium-term price model for Natural Gas remains bearish
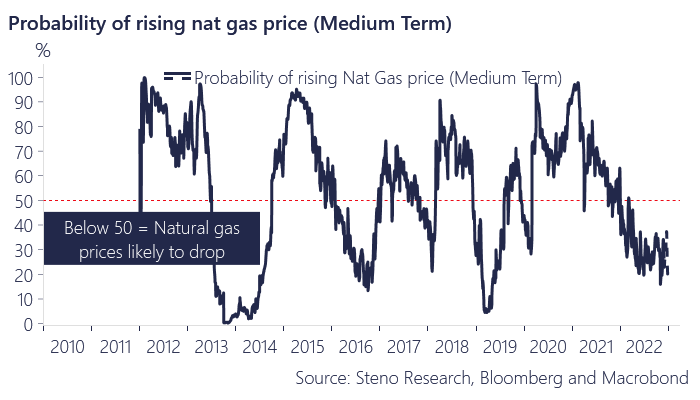
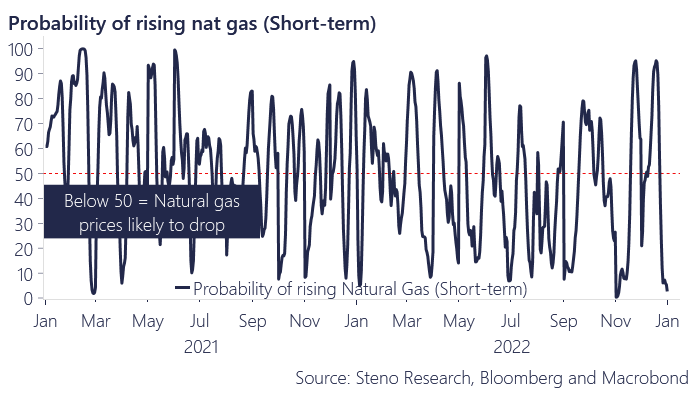
In our very near-term model, where we allow weather to have a bigger impact, we get a very firm sell-signal for natural gas due to a continued warm outlook relative to history, which is usually a hint of negative price action in European energy/electricity markets for the coming 14 days.
A lot of bad policies have been implemented in Europe this year, but for now we shouldn’t worry too much about the situation. Price action looks bearish still.
Chart 12: Short-term price model for Natural Gas is ultra bearish
We hope you enjoyed this first edition of “The Energy Cable” and hope to see you back next week as a subscriber.
Get your subscription today right here.
Best wishes for 2023 from Andreas Steno and Warren Pies
DISCLAIMER
The content provided in Stenos Signals newsletter is for general information purposes only. No information, materials, services, and other content provided in this post constitute solicitation, recommendation, endorsement or any financial, investment, or other advice. Seek independent professional consultation in the form of legal, financial, and fiscal advice before making any investment decision. Always perform your own due diligence.
20230103