Steno Signals #27: “The Tanned Grinch”


“The Tanned Grinch“
Lagarde starred in the role as the slightly more tanned Grinch as central banks decided to ruin Christmas. Structural liquidity doesn’t look too bad and 2023 is not necessarily the year of the bear.
Forget about a merry equity Christmas!
That is my take-away from a week of hawkish central bank action with Christine Laggard starring as the slightly more tanned Grinch in the most hawkish ECB meeting, that I have ever experienced (remember that I was still wearing diapers when Trichet pulled the rug from under the European labor market)
The ECB predicts core inflation to print at 4.2% through 2023, which is the most hawkish staff projection I have ever seen.
If the ECB intends on following the J-Poww playbook, they will likely aim at bringing the repo rate above 4.2% with positive real rates THROUGH the curve. In such case, OH BOY, EUR interest rates are mispriced still. The safest way to play this story is probably in EUR curve flatteners (2s10s) as it has lagged the USD curvature by 6-7 months through this cycle.
Chart 1. US curve leading the EUR curve
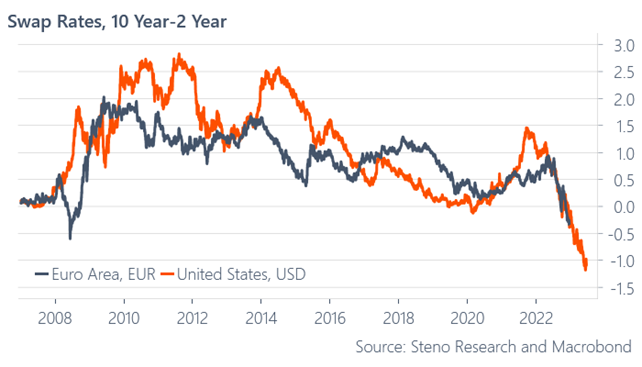
Is it sensible that the EUR curve lags the USD curve by 6-9 months? Well, indeed.
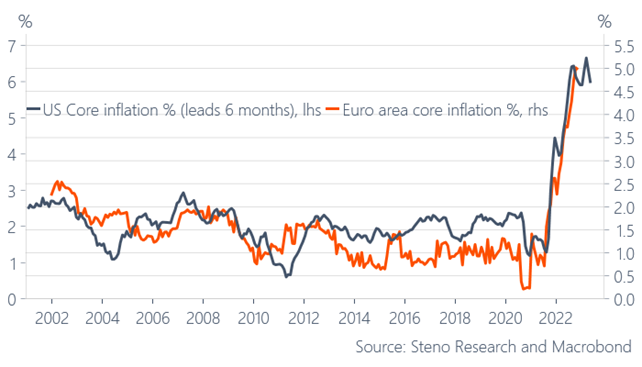
Empirically speaking, the USD inflation outlook leads its European peers (EA+UK) by around the same horizon. Based on 23 years of time series history, the highest correlation between USD and EUR inflation is found with a 5-7 months’ time-lag, which means that the impulses from the US economy tend to get exported both via the FX channel and via the labor market channel over time.
We should hence expect EUR core inflation to remain HOT until at least the March-meeting in 2023, allowing Lagarde to continue her new-found hawkishness into the new year. This is initially EUR positive, until it no longer is.
Chart 2. European inflation lags the inflation seen in the US by 5-7 months
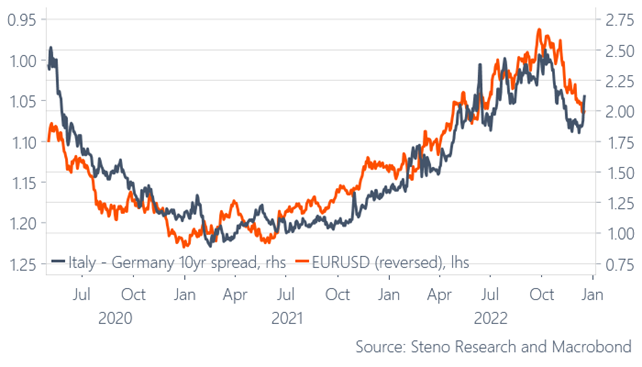
The modus operandi is the following for the EUR, when the ECB turns aggressive: 1) EUR gains as EUR real rates are repriced, 2) markets start testing the ECB resiliency towards wider intra-Euro-zone spreads, 3) EUR drops again unless the ECB accepts calming down spreads. For now, the EUR and Ital-German spreads are moving in the same direction, which is typically a short-term anomaly that does not persist.
We are going to move from phase 1 to phase 2 already soon allowing phase 3 to kick in during Q1-2023 as well, but for now I am not willing to pull the trigger on a short EUR vs. USD idea.
The 2s10s flatter in ze German curve or in EUR swaps is THE bet for now.
Chart 3. EURUSD and 10yr Ital-German spreads sitting in a tree – KISSING! But for how long?
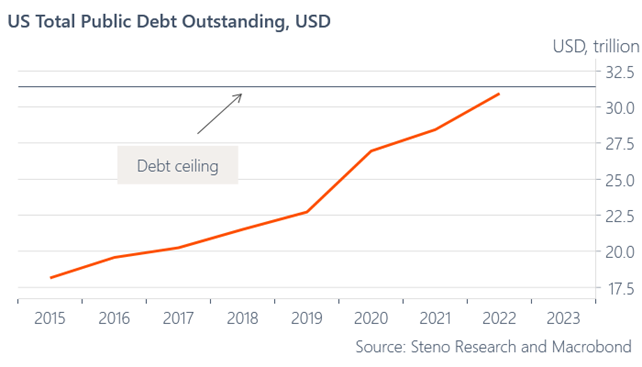
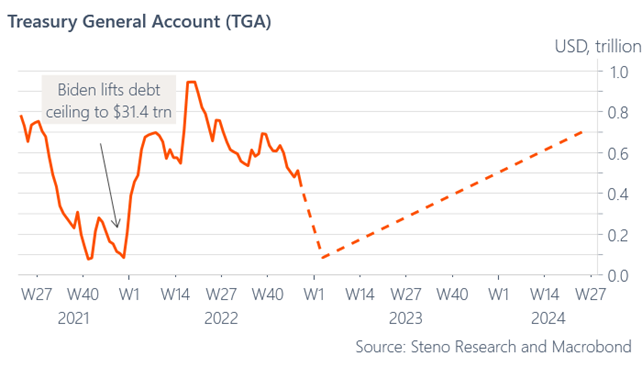
The liquidity outlook in the US also speaks in favor on continued hawkishness by the Fed as the debt ceiling looms. The ceiling at 31.4 trillion looms in Q1 and the x-over date is likely to occur during the first quarter as well since the TGA (Treasury General Account) is no longer booming as it was earlier this year. This is an interesting story for the USD liquidity outlook, even if it based on technicalities.
Chart 4. The ceiling is BACK
In order NOT to incentivize politicians to negotiate for ages, the US Treasury isn’t allowed to hold plenty of cash ahead of a debt ceiling deadline. The modus operandi is to bring the TGA to the level seen when the debt ceiling was lifted and when Biden signed the new debt ceiling in Dec-2021, the TGA was printing as low as $85bn.
The TGA is hence likely to drop to <$100 bn levels in the early parts of Q1-2023 as we approach the debt ceiling and remember that this ADDS liquidity to private markets as the US Treasury releases liquidity from its own account.
Chart 5. MORE liquidity to arrive from the US Treasury
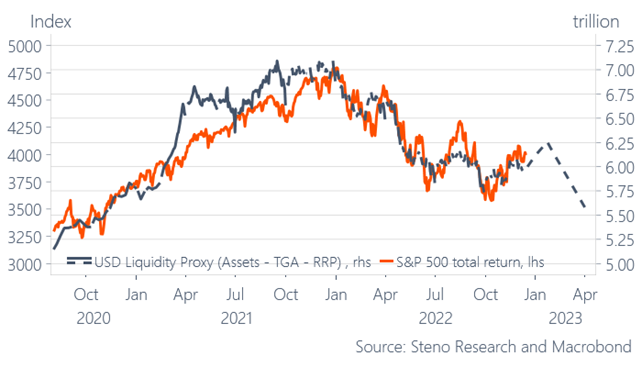
This is likely net/net going to be enough to increase liquidity in USDs into January, which is a tailwind for equities relative to a scenario without added US Treasury liquidity. If the US Treasury prints even fewer bills, we may have to add a dynamic scenario with increasing RRP usage as well, but the net/net picture looks liquidity positive in any case.
This will likely annoy Jay Powell and the Fed, since this is the part of the USD liquidity equation that they cannot truly control and currently it helps revive animal spirits at the worst possible timing. Expect the Jay-Man to remain hawkish into the new year as a consequence, even if he both hopes and contemplates that the hiking cycle is soon over.
As soon as the debt ceiling is lifted (again), we should expect a double QT whammy from both the TGA and the actual QT process leading S&P 500 lower again. This is also going to be your EXACT timing to put on USD positive bets versus EUR again. For now, playing USD from the short side versus peers makes more sense.
Chart 6. USD liquidity looking OK’ish due to debt ceiling considerations for now
Finally, let me briefly touch upon the almost hilarious investment bank consensus right now. They all expect a weak stock market in Q1, which will lead the Fed to pivot and allow equities to rally in to H2-2023, which is an argument to expect a different playbook to ACTUALLY occur.
Let me put it like this. They focus WAY too much focus on the price of money, instead of focusing on the quantity of money.
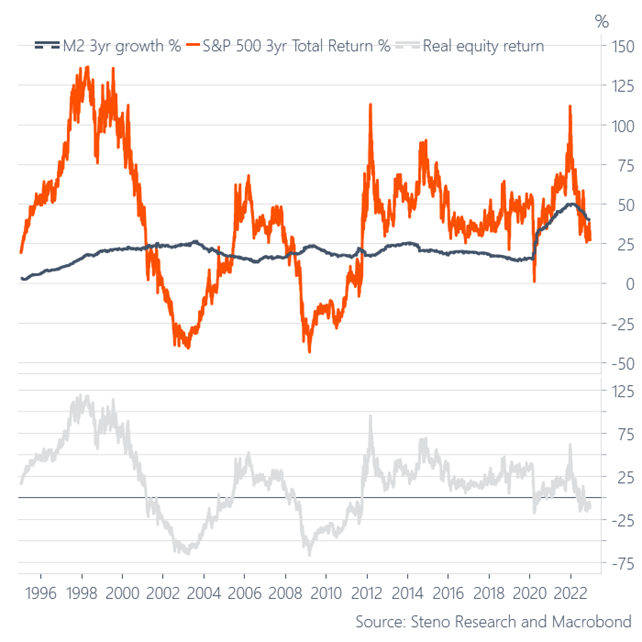
The 3yr running total return of S&P500 is still around 27% even if it includes one and soon potentially two economic recessions, and the reason for that ought to be the quantity of money. We are already in CLEAR negative territory, if we adjust the return for the growth in the supply of money through over the past 3yrs, but still way from 2002/2009 real (and nominal) return territory.
Chart 7. Remember that the REAL equity performance is already very bad
The truckload of fresh USDs hasn’t been sucked out of the economy to any large extent still, which is why the downside is not really materializing despite this being the most well-announced recession in history before it even hits. And as we have already start begging and praying that J-Pow stops withdrawing liquidity, it is not certain that the overall downside will prove to be material.
Chart 8. Inflation down, equities up 1970s style? Jay will decide

Due to this directional uncertainty, I decide to stick to my guns:
Long Staples vs. short Tech or Discretionary (tremendous performance so far) and long Industrials vs. Energy (on a lower energy price bet) and then I add a 2s10s flatter in EURs, while I am scaling down on my holdings of excess liquidity in MXN and USD (and bringing them back to EURs for now).
Chart 8. We are onboarding our first institutional clients now with an early bird discount

Please visit www.stenoresearch.com to follow our developments – we have exciting news upcoming soon. If you are interested in an institutional coverage, please contact me directly at andreassteno@stenoresearch.dk – we are onboarding clients already now.
For my Danish readers: We will host a live-event at Bremen Teater Feb 8 2023 – tickets are found right here -> https://allthingslive.dk/event/millardaerklubben-live
DISCLAIMER
The content provided in Stenos Signals newsletter is for general information purposes only. No information, materials, services, and other content provided in this post constitute solicitation, recommendation, endorsement or any financial, investment, or other advice. Seek independent professional consultation in the form of legal, financial, and fiscal advice before making any investment decision. Always perform your own due diligence.
20221219