Steno Signals #19: 1, 2, 3, Central Bank Panic

1, 2, 3, Central Bank Panic
BoE’s involuntary policy mix
Last week the Bank of England intervened in the market and bought long-dated gilts in a last resort effort to save pension funds from getting too big margin calls. This intervention worked as intended, and we saw yields coming down. Whether this intervention falls in the category of yield curve control, QE or a third can be argued, but it certainly contradicts QT and rate hikes. Desperate times call for desperate measures, I guess.
Chart 1: GBP yields and intervention
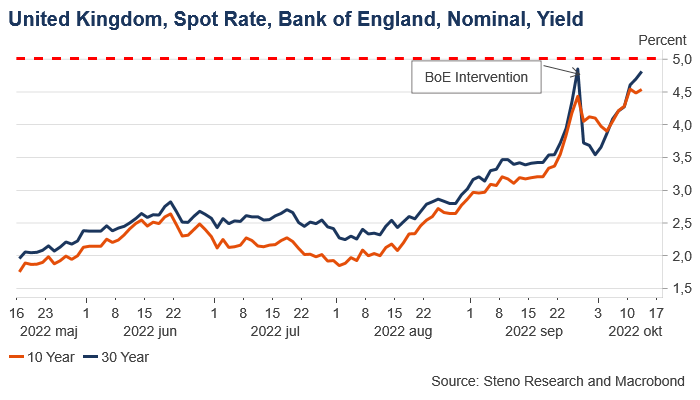
On the 28th of September, the Bank announced that, in line with its financial stability objective, it would make targeted and temporary purchases of gilts to help restore market functioning and reduce any risks from contagion to credit conditions for households and businesses. They would step in as the market maker of last resort.
Following a sharp rise in yields Monday 10th of October, BoE announced a widening of its intervention. Its bond-buying program is intended to push yields lower and thus help Liability Driven Investment funds to address risk to their resilience from volatility. Though LDI funds have made considerable progress, this week has seen further significant repricing of UK government debt. Therefore, they decided to widen their intervention further and 5 of 10B allocated daily will now be used to buy index-linked gilts, as the prospect of self-reinforcing ‘fire sale’ dynamics pose a material risk to UK financial stability.
Chart 2: Workings of Interest Rate Swaps (IRS)
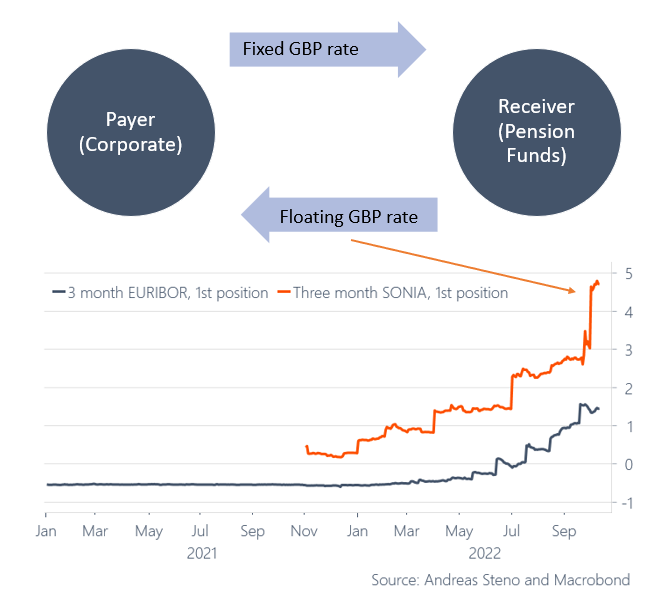
Now, Bank of England Governor Andrew Bailey has warned fund managers that they have until the end of this week to unwind positions they can’t maintain before the central bank halts its market support. That said, according to Financial Times, officials have privately indicated a flexible approach should market volatility flare up, in spite of Baileys warning – Do they really have a choice? For now, they communicate that this is a MASSIVE bucket of exit liquidity, but what about next week and the week after?
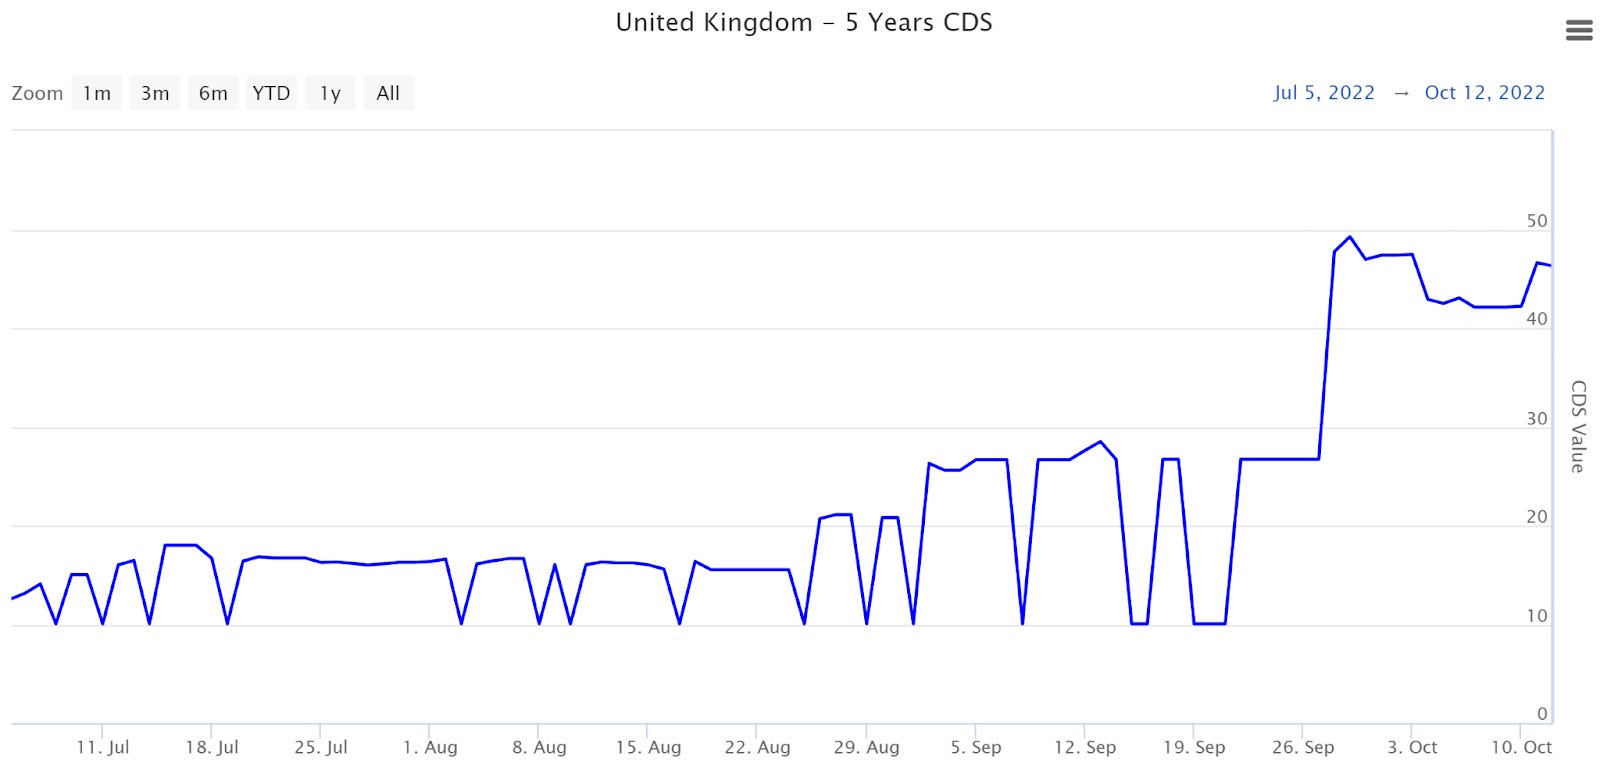
The cost of insuring Britain’s debt against a default jumped to its highest level since mid-2020 on September 29 as concerns mounted about the government’s plans to slash taxes and ramp up spending. With the back-paddling on the mini budget and BoE’s purchasing programme of gilts, we saw CDS-levels ease. Whether the BoE will prolong and widen their intervention and hence come to the rescue will most definitely impact the CDS-levels.
Chart 3: UK sovereign 5 year CDS
Between a rock and a hard place
Any economic textbook will prescribe monetary and fiscal tightening as a first line combattant against inflation. But, we find ourselves stuck in a mess, where, no matter how much we ‘ought’ to, we may not be able to tighten without breaking either the bond-market or the foreign exchange rate. The UK real rate is indeed a reaper. If the real yield, despite efforts, won’t come down, we could be involuntary spectators of an outright massacre of risk assets.
Chart 4: Index Linked Yield average in GBP – AAAAAAAAAAAAAAAAAAAAH!
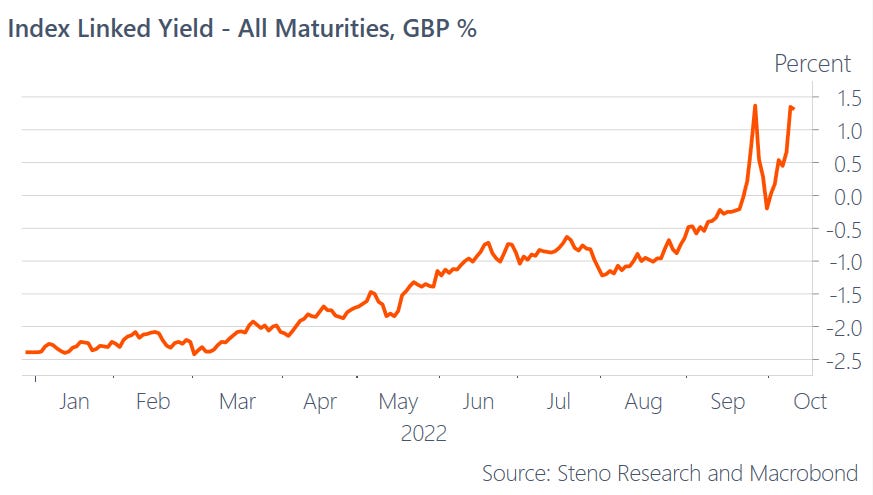
The UK have shown their hand and, for now, stepped in to rescue their bond-market and hence peoples retirement funds. Whether Bailey will walk the talk and halt BoE’s intervention is to be found out, but it will definitely set precedence.
The UK market isn’t the only one taking a beating or facing risks. Risk gauges in Germany’s government debt market rose last week to levels surpassing those of ‘08. Big institutional investors that spent years insuring their portfolios from falling interest rates now face immense losses as their hedges blow up. I imagine that a lot of European policy makers are weary of the situation and will try and draw some experience, should their domestic markets turn sour.
In covid terminology, the UK may very well just be patient zero.
Fed is literally paying the price for their hikes
The next upcoming headache for the Fed is the price they are going to pay for their hikes. As of last month Jay Powell is now posting an operating loss and while that might not be a problem for now, it could be a political issue down the road, especially if we are looking into permanent higher rates.
Chart 5. Weekly remittances from the Fed to the US Treasury
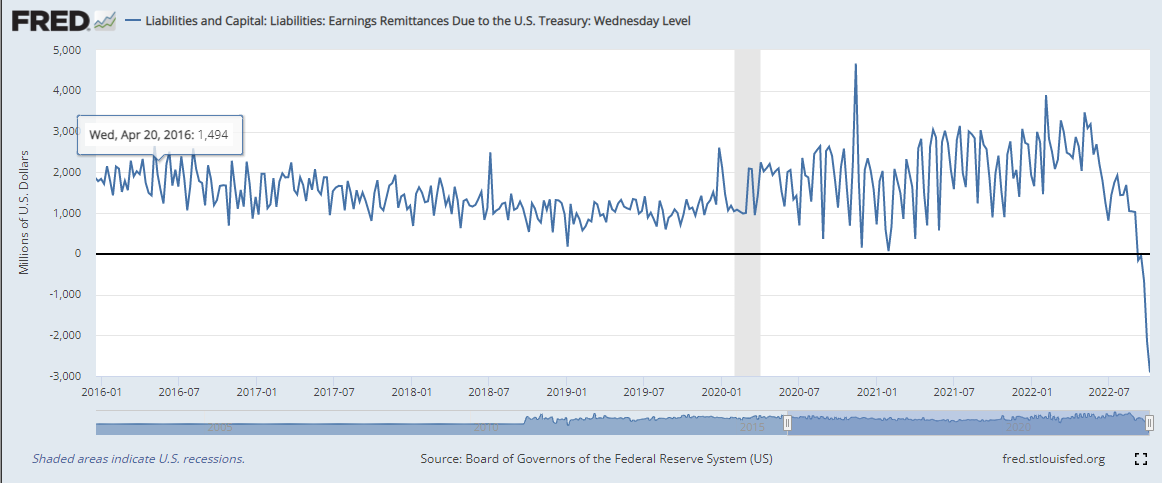
Currently, the Fed is paying banks interests on their deposits to non-public-sector counterparts, while earning interests on their portfolio of fixed income. Thus, the flatter (or inverted) the curve, the more expensive it gets for the Fed.
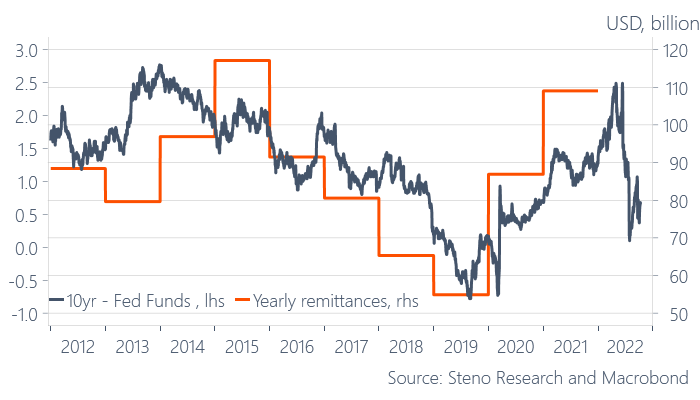
Since the Fed is pretty clear that they are going to keep fighting inflation, it is going to get more and more expensive from here on out. Jay Powell could make it a deferred liability on his balance sheet thus postponing the payments, but regardless this remains an ultimate tax payer problem. At least if inflation remains so high that the Fed cannot print their way out of troubles. This could be a headache for the government at some point, since they not only would have to fund themselves, but also their central bank.
Chart 6. The shape of the USD yield curve relative to annual remittances to the US Treasury
Portfolio update – time to think about Mazlow again
I have closed all of my disinflation portfolio. Disinflation has actually been traded pretty clearly, since I put my trade on. Inflation break-evens are down massively, real rates have shot up, commodities have sold off, but bonds have NOT performed. While I did okay with my short DAX/long S&P and my short commodities and got humbled by bonds yet again, I was only saved by the FX part of that trade. I still believe in the disinflation story, but the spike we have seen in real rates makes me change my focus in the market from disinflation to the ramifications of rising real rates and today’s inflation report (even if the peak is most likely in – that is still fair to say) will likely enforce the environment of higher real rates.
Since the bond market is totally out of sync with the inflation market now, we are trading mostly on credit premias given the massive amount of horrible political decisions. The trust in the system is declining and both central banks and politicians are contributing to that.
Chart 7. Real rates vs. Equity Forward PEs – AAAAAAAAAAAH!
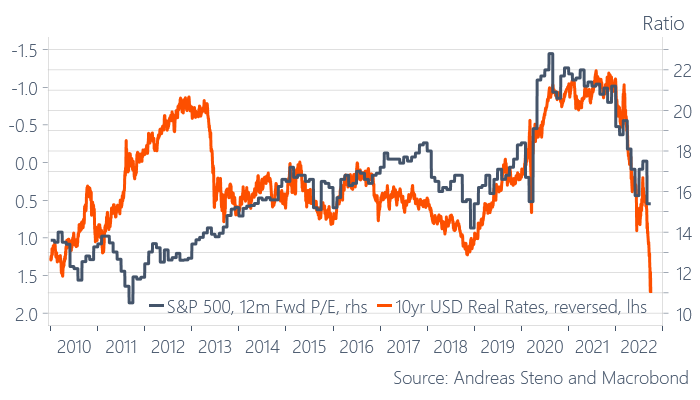
In equity space, I am leaning short stocks with a high Fwd P/E (Think consumer discretionary and tech) and leaning long stocks with a low Fwd P/E (Think staples, utilities and energy). Basically I am trying to say short things in the top of Maslow’s hierarchy of needs and long things in the bottom of it. Thus I have added one unit of MSCI World Consumer Staples and one unit of Proshares short QQQ ETF.
Furthermore I have increased my amount of excess liquidity in USD and MXN. Cash is king in this environment, and you will be able to pick up things that are dirt cheap in 6-7 months from now, I think.
To sum up: Long USD, MXN and a bit of BRL vs. EUR, long CZK/HUF on relative electricity woes and short stocks with a high P/E relative to stocks with a low P/E.
Enjoy the ride.
Remember to listen to “The Macro Trading Floor” each and every Sunday. We are hosting my former boss on Sunday for a killer cross-asset interview. Stay tuned!
https://embed.podcasts.apple.com/gb/podcast/the-macro-trading-floor/id1618502265
DISCLAIMER
The content provided in Stenos Signals newsletter is for general information purposes only. No information, materials, services, and other content provided in this post constitute solicitation, recommendation, endorsement or any financial, investment, or other advice. Seek independent professional consultation in the form of legal, financial, and fiscal advice before making any investment decision. Always perform your own due diligence.
20221013