S&P500: Levels to Watch

The S&P500 continues to push higher following the Covid inspired pullback of early 2020. In this article I take a look at the chart of the S&P500 and highlight the key Support and Resistance levels that I consider worth monitoring. My approach to technical analysis is from a top down perspective which means I start at the longer-term charts and drill down from there. I start the article with a reminder of the need for perspective before exploring the relevant Support and Resistance levels I consider worth monitoring.
Perspective:
S&P500 yearly: the yearly chart below shows that the Index has been in an overall uptrend since its inception. My background is in Science and, as a consequence, I regularly search for repeatable patterns. The pattern on the chart seems to be one of periods of sideways congestion followed by periods of uptrend. The current uptrend following the last period of congestion is around 8 years in duration. No one can know with any certainty what the next major directional move for the index will be but I keep this chart in mind in the face of S&P500 Bears. There is a well-worn saying that ‘History may not repeat itself but it often rhymes’. I would simply urge all S&P500 traders and investors to keep an open mind.
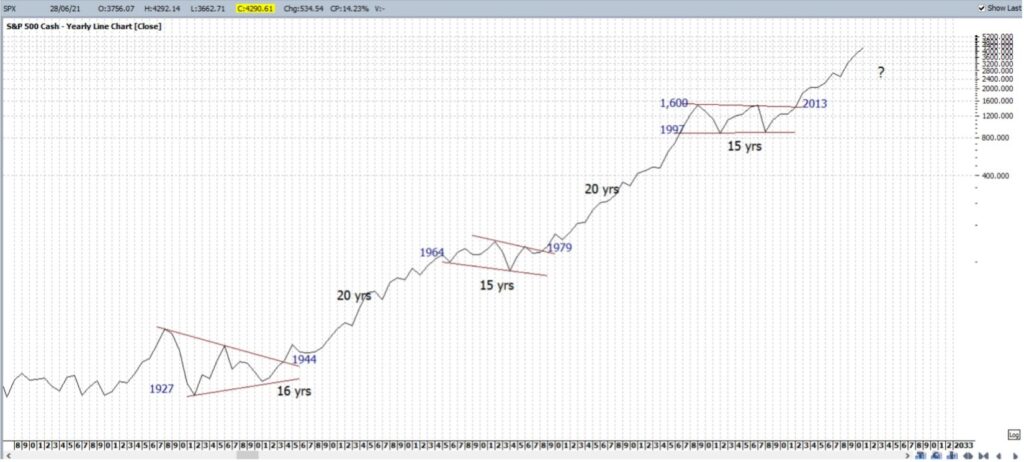
S&P500 yearly: note the overall uptrend.
Support levels to monitor:
S&P500 weekly: the chart below shows two key events for the Index. Firstly, the Covid-inspired pullback from Feb 2020- March 2020 and, secondly, the Covid recovery rally from March 2020 to present time. There is a 16-month support trend line in place but note how momentum, of late, is declining and converging. Some analysts might point this out as bearish divergence and proof of a looming pullback but I would urge caution with that view. It could also simply represent a pause before the next major upthrust so, as mentioned above, I urge S&P500 traders and investors to keep an open mind.
Any break of this 16-month support trend line would have me, in the first instance, looking for potential sideways consolidation to form a Bull Flag. However, any bearish continuation after that would bring whole-number levels on the way down to the 61.8% Fibonacci retracement of the March 2020 – present time swing High move. The 61.8% Fibonacci level is a popular level used by analysts and is near the 3,000 level.
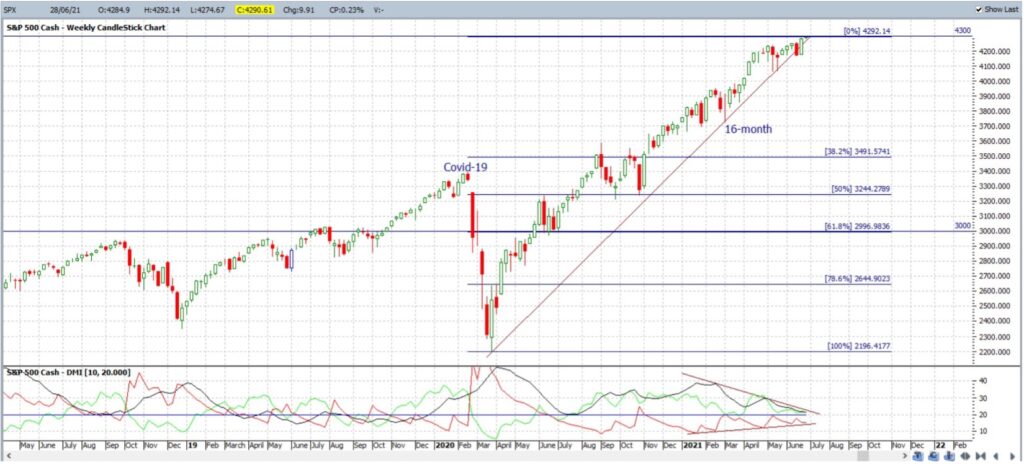
S&P500 weekly: note the 61.8% Fibonacci retracement near 3,000.
S&P500 daily: As well as using Fibonacci to help identify potential pullback targets it is worth looking for key Support and Resistance levels (S/R). This is achieved by looking for horizontal levels where price action more frequently reacts by way of a bounce or a pullback. For major stock indices, like the S&P500, the whole number levels tend to be key ones to monitor but the chart below shows that some of these are more prominent in their importance for the S&P500 than others. Some key levels that jump out on the S&P500 for me seem to be: 4,100, 3,800, 3,600, 3,400 and 3,000. These would be added to list of Support levels to monitor as well as the 61.8% Fibonacci level of 3,000.
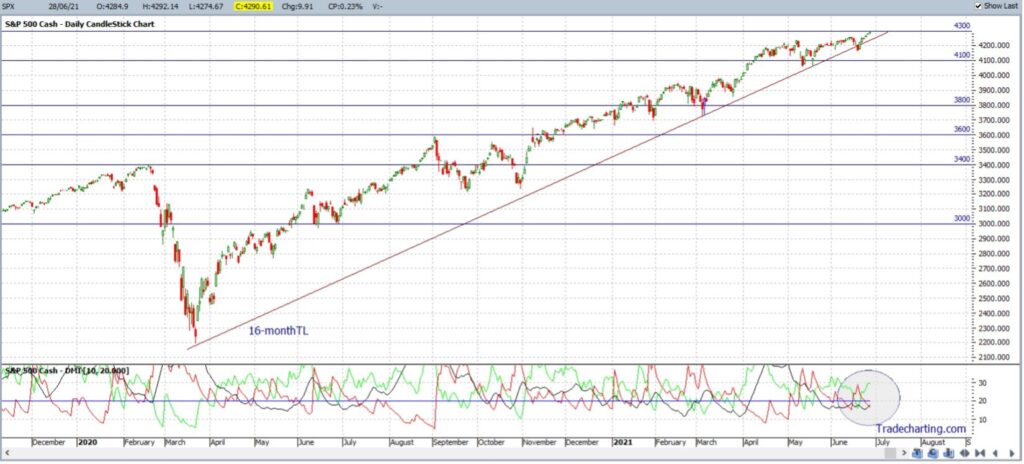
S&P500 daily: note the numerous horizontal S/R levels.
Resistance levels to monitor:
S&P500 weekly: Whole-number levels will feature as Resistance levels to monitor for the S&P500in the same way as they act as Support. Thus, the first major whole-number level to monitor for the S&P500 is the 4,300 level. All other whole numbers levels above that will feature as well.
To explore other potential Resistance levels I have applied a Fibonacci extension to the Covid-inspired Swing Low. The Index has spent the last few months bouncing around the 4,150 level and regular readers of my work will know that I have been emphasising this key level since December 2020 as a key one to monitor. The reason for monitoring this 4,150 level is that it is near the 161.8% Fibonacci extension of the Covid swing Low move.
Other key extension levels to monitor include the 200% extension, near 4,600. Although the 200% level is not a true Fibonacci level it is often noted due to the whole-number nature, as is the 300% level which is near 5,780 for the index.
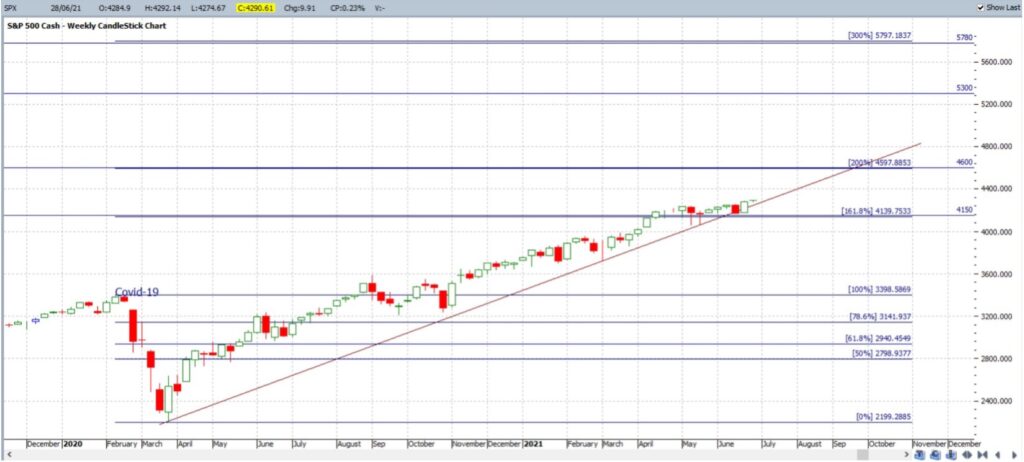
S&P500 weekly: note the 161.8% Fibonacci extension near 4,150.
S&P400 4hr: the importance of the 4,150 level is highlighted on this 4hr chart where it can be clearly seen to have been tested, and held, with the recent pullback and temporary drop below the 16-month support trend line.
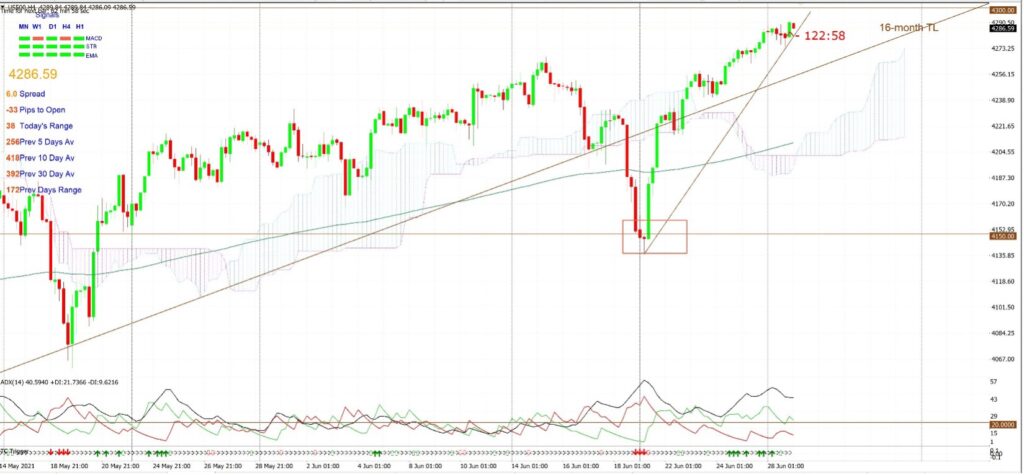
S&P500 4hr: note the hold above 4,150.
Summing Up: Technical analysis can be useful to identify key Support and Resistance (S/R) levels for the S&P500 index. Key levels identified in this article are summarised below:
Support levels:
- 4,150: as this is the 161.8% Fibonacci extension of the Covid inspired swing Low (Feb 2020- March 2020).
- 4,100: as an S/R level.
- 4,000: as a whole number levelas well as all whole-number levels below.
- 3,800: as an S/R level.
- 3,600: as an S/R level.
- 3,400: as an S/R level.
- 3,000: as this is the 61.8% Fibonacci retracement level of the March 2020-present swing High move.
Resistance levels:
- 4,300: as a whole number levelas well as all whole-number levels above.
- 4,600: as this is the 200% extension of the Covid inspired swing Low (Feb 2020- March 2020).
- 5,780: as this is the 300% extension of the Covid inspired swing Low (Feb 2020- March 2020).
About the Author:
Mary is a technical analyst and private trader based In Sydney, Australia and a member of the Australian Technical Analysts Association (ATAA). More information about her analysis and trading style can be found at Tradecharting.com.
Mary McNamara


