Semi’s Attempting to Break Through Resistance, What Does it Mean?

Semi’s Attempting to Break Through Resistance, What Does it Mean?

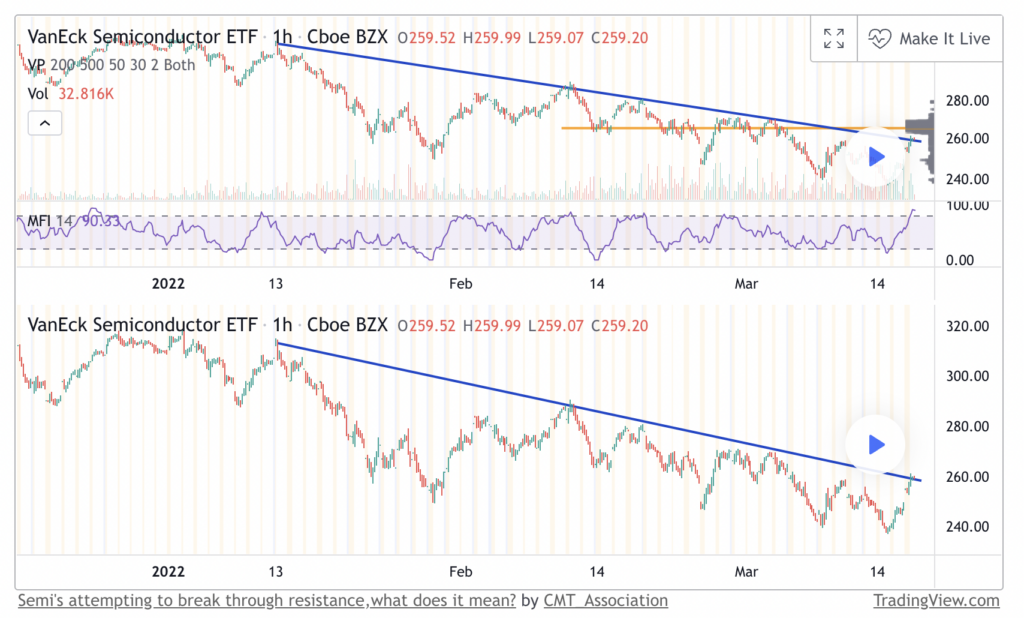
The Semiconductor ETF SMH is meeting resistance here @ 260. The last several times the SMH index ETF met this trend resistance has resulted in a push to lower lows. Could this time be different? The MFI ( Money Flow Index) seems to be suggesting it is a possibility. Although SMH is riding a downtrend, SMH price volume momentum is in overbought territory. A SMH break and close above 260 on a daily basis would end the SMH down turn. The next important area to watch would be 266. 266 is where major resistance resides. This is evidenced by the significant battle between bulls and bears previously waged there noted in Volume @ Price. The last time @ 266, the bears got the better of the SMH bulls. However, this SMH MFI is trending higher as opposed to lower. This is a canary in the coal mine to watch as this battle could have repercussions as to the future direction of the broad market trend and ensuing market leadership.
Shared content and posted charts are intended to be used for informational and educational purposes only. The CMT Association does not offer, and this information shall not be understood or construed as, financial advice or investment recommendations. The information provided is not a substitute for advice from an investment professional. The CMT Association does not accept liability for any financial loss or damage our audience may incur.
20220317


