Mish’s Daily: Stock Price Divergence and Potential Signs of Risk


Mish’s Daily: Stock Price Divergence and Potential Signs of Risk
Written by Michele ‘Mish’ Schneider
We cannot begin the Daily without a mention of the glitch in the NYSE right out of the gate Tuesday morning.
A wild stock-price swing occurred at the open and 84 stocks suddenly plunged or spiked causing volatility triggers and trading halts.
The event is now under investigation.
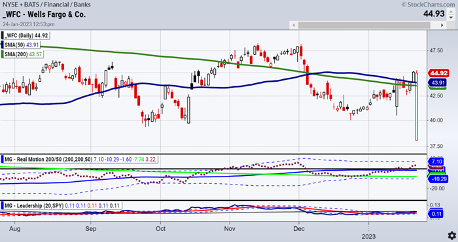
The chart of Wells Fargo is a prime example of how this glitch wreaked havoc with a low price of $38.10 before rallying back up to $45.00
Perhaps we can notch this up to “Another Brick in the Wall” of chaos leading to inflation.
Regardless, with earnings season in gear, the market will focus on the guidance and future outlook of many of the large corporations, so today’s glitch could be an aberration or the universe’s harbinger of things to come.
Monday, we focused on the trading range, calendar ranges, momentum, junk bonds’ performance and the very high probability of a rally into resistance.
Today, let’s narrow it down to another of our key indicators in our Big View market timing service
Long Bonds versus High Yield Bonds
Tuesday’s action settled into more of a digestion day in the 4 indices.
The small caps or Russell 2000 (IWM) had an inside day meaning it traded within the trading range of Monday.
The 6-month calendar range high sits just above current levels in the small caps. Hence, we need clues from the internals on next big move up or down.
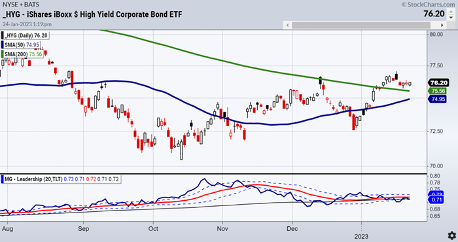
The iShares iBoxx $ High Yield Corporate Bond ETF HYG looks ok as far as price.
Our Big View defines the relationship or ratio between HYG and TLT as a measure of the relationship between risky high yield corporate debt (HYG) versus the safety of U.S. Bonds (TLT).
“When the ratio is trending up and the distance between the ratio and the moving average widens, it identifies an increased appetite for risk in fixed income markets.”
However, as shown by our Triple Play Market Indicator, high yield continues to underperform the long bonds or TLTs. Although the price is trending up on junk bonds, this underperformance versus the long bonds may be warning signs of possible failing breakouts.
Mish’s Picks are already up 10-20% outperforming the SPY!
Want to take advantage of her stellar track record and ensure a profitable trading year?
For more detailed trading information, contact Rob Quinn, our Chief Strategy Consultant, to learn more about Mish’s Premium trading service.
You don’t want to miss Mish’s 2023 Market Outlook E-available now

Click here if you’d like a complimentary copy of Mish’s 2023 Market Outlook E-Book in your inbox.For more detailed trading information, contact Rob Quinn, our Chief Strategy Consultant, to learn more about Mish’s Premium trading service.

Get your copy of “Plant Your Money Tree: A Guide to Growing Your Wealth”
Grow Your Wealth Today and Plant Your Money Tree!

“I grew my money tree and so can you!”- Mish Schneider
Mish in the Media
BNN Bloomberg NYSE Glitch Thoughts 01-24-23 or on MarketGauge YouTube
Business First AM 01-24-23 or on MarketGauge Channel
Making Money with Charles Payne, Fox Business 01-19-23What Could Spur Inflation – Let Us Count the Ways
CNBC Asia 01-18-23Risk On or Off – Meme Stocks hold a Clue
Charting Forward: Q1 Market Outlook 01-13-23
StockchartsTV
2023 Stock Market Forecast: Where’s the Strength?
ChartWatchers | StockCharts.com.01-19-23
Bloomberg BNN 01-11-23Global Inflation Points and Market Opportunity
Stockcharts Your Daily Five 01-12.23
StockCharts.com
Benzinga 01-11-23How to Grow Your Wealth in 2023
StockCharts – Final Bar 01-11-23StockCharts.com, Know Your Timeframe
Business First AM 01-09-23Inflation Worries WORLDWIDE
ETF Summary
S&P 500 (SPY) SPY has crossed the 200-DMA and is now slightly above it, but is still a very narrow price range below to 50-DMA. Held pivotal support and now what was resistance is support at the 200-DMA and resistance is 405 overhead.
Russell 2000 (IWM) Filled the gap and continued to hold the 200-DMA and overhead resistance at 189.
Dow (DIA) Back under the 50-DMA STILL as industrials lose ground to tech, but holding support at 335 and crossed the 50-DMA barely.
Nasdaq (QQQ) Crossed the 50-DMA on Friday to close above. First level of resistance is at the 200-DMA and closing slightly below it.
Regional banks (KRE) Close to crossing 60.72 (50-DMA). First level of support is 58 and resistance is 50-DMA.
Semiconductors (SMH) Still holding key support easily at the 50-WMA and 200-WMA. 230 support and 238 resistance.
Transportation (IYT) Still holding 225 key support here and now holding first level of support holding 227. Overhead resistance is 232.
Biotechnology (IBB) Still best sector with 132 key support still holding and holding first level of support at 134 now with 137 resistance.
Retail (XRT) Holding pivotal support at 63. Resistance at 68.
20230125