Mish’s Daily: Hot Gold Drops and Shaky Semis Pop


Mish’s Daily: Hot Gold Drops and Shaky Semis Pop
Written by Michele ‘Mish’ Schneider and Geoff Bysshe
Today I’ve got a handful of bullish stock charts for your watchlist next week.
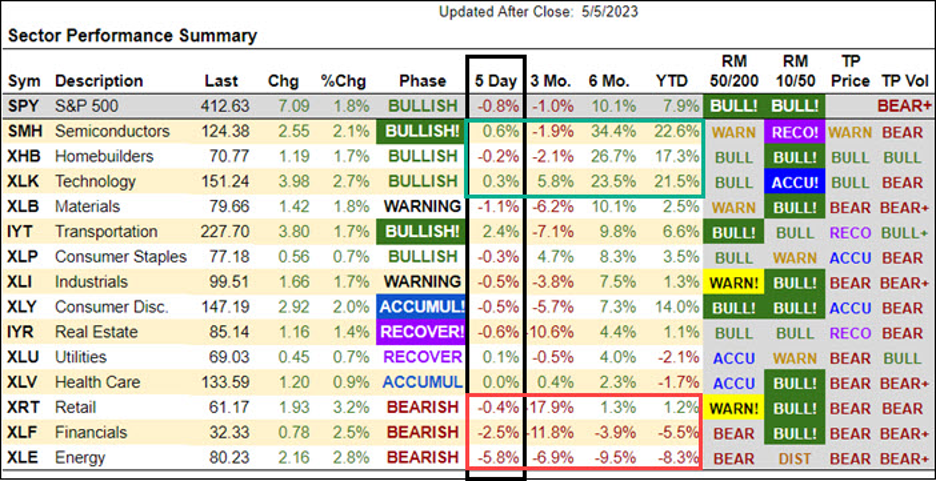
The importance of these stock charts begins with the table shown above. You can find this Sector Summary table updated daily at www.marketgauge.com/sectors.
If you were watching the market last week, it probably didn’t feel cal or uneventful. However, as you can see from the “5 day” column highlighted in the Sector Summary table above, the end result was relatively unchanged in most sectors.
One notable pattern, also highlighted, is that the top 3 sectors based on 6-month percent change were also the better performers for the week and on Friday.
Likewise, the worst performing sectors for the week are also the worst performers over the last 6 months and year-to-date.
This pattern of the relatively strongest groups or stocks continuing to outperform while the laggards continue to lag is a well known tendency of the market that we exploit in several of our trading systems. In recent Mish’s Daily articles I’ve suggested that gold was poised to move higher, and the semiconductor sector ETF (SMH) was weak and likely to break below its 50-day moving average and decline.
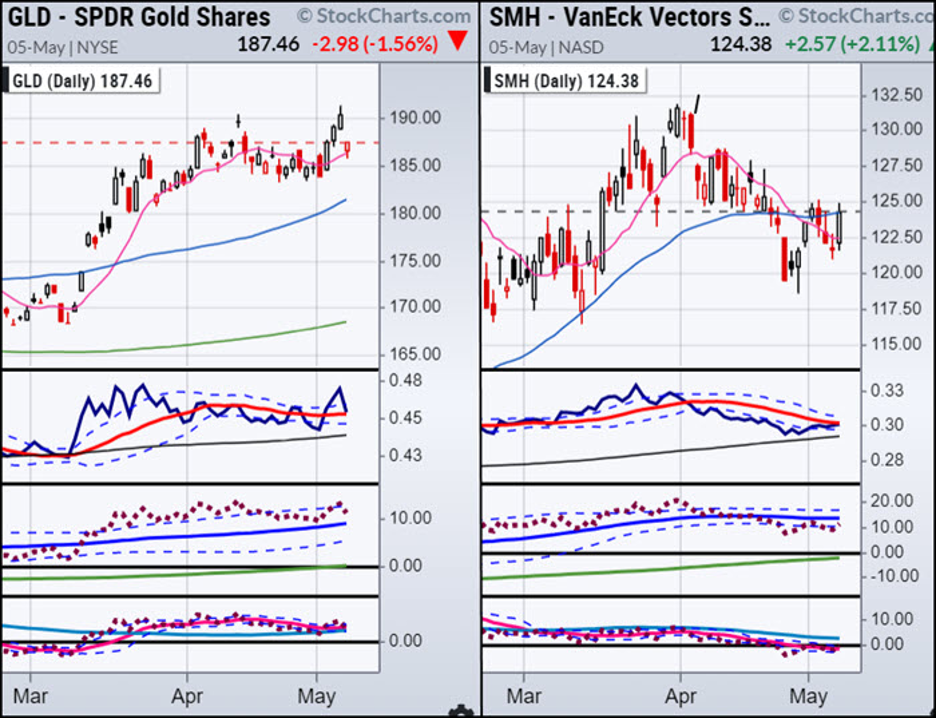
Leading up to the employment report on Friday gold was rallying and SMH was rolling over.
However, the report suggested that the economy was stronger than expected, which pushed the stock indexes and the semiconductor sector (SMH) higher. If it trades back over $125 its pattern will turn bullish.
At the same time, gold gapped down on Friday, and then it rallied though out the day.
Is the gap down in gold a dip to buy or a significant top? Will SMH break higher?
In both cases, a move over Friday’s high would be a good reason to look at long trades in the ETFs or in leading stocks in their respective groups.
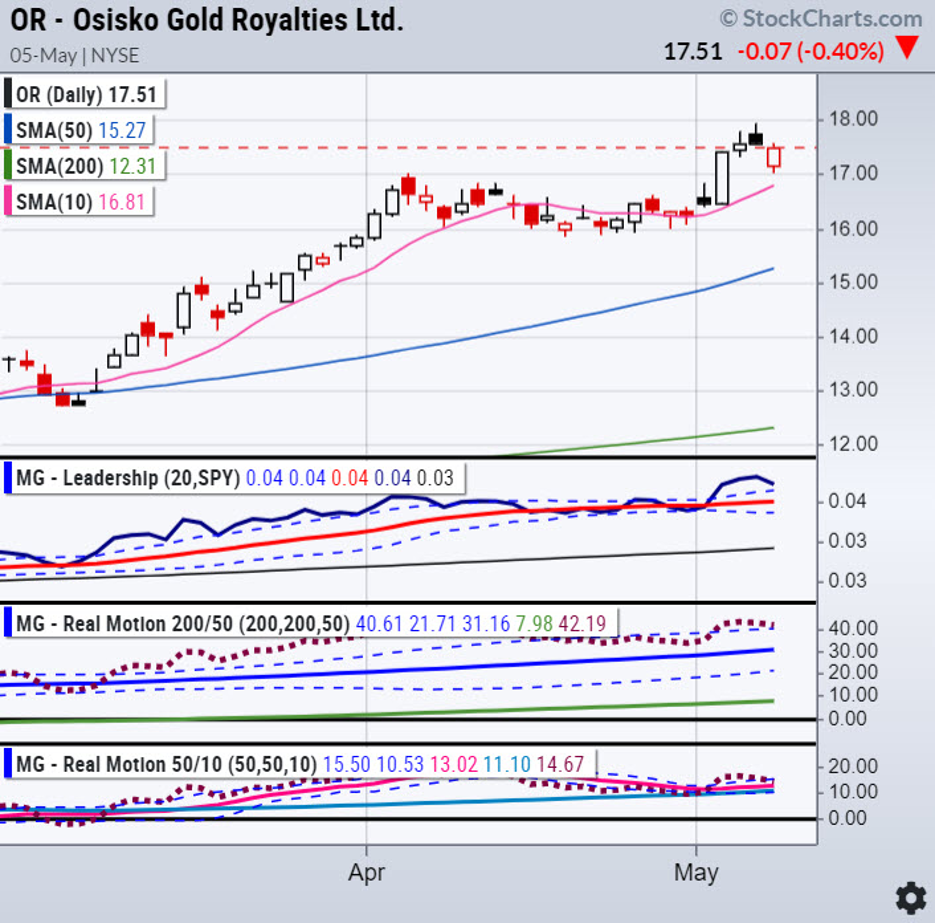
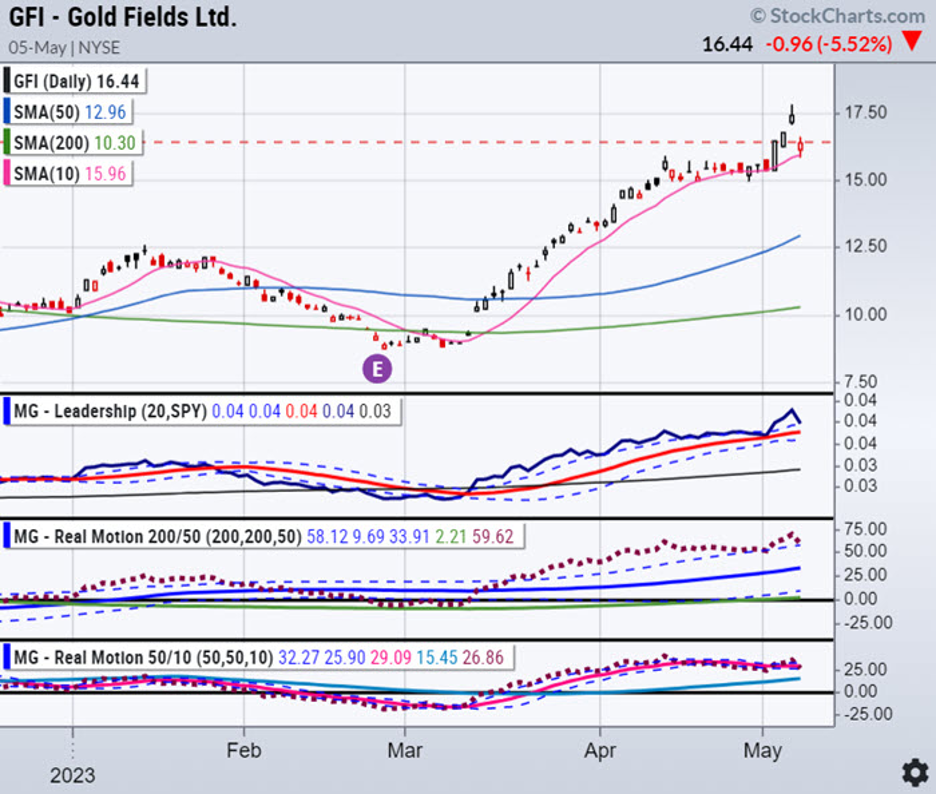
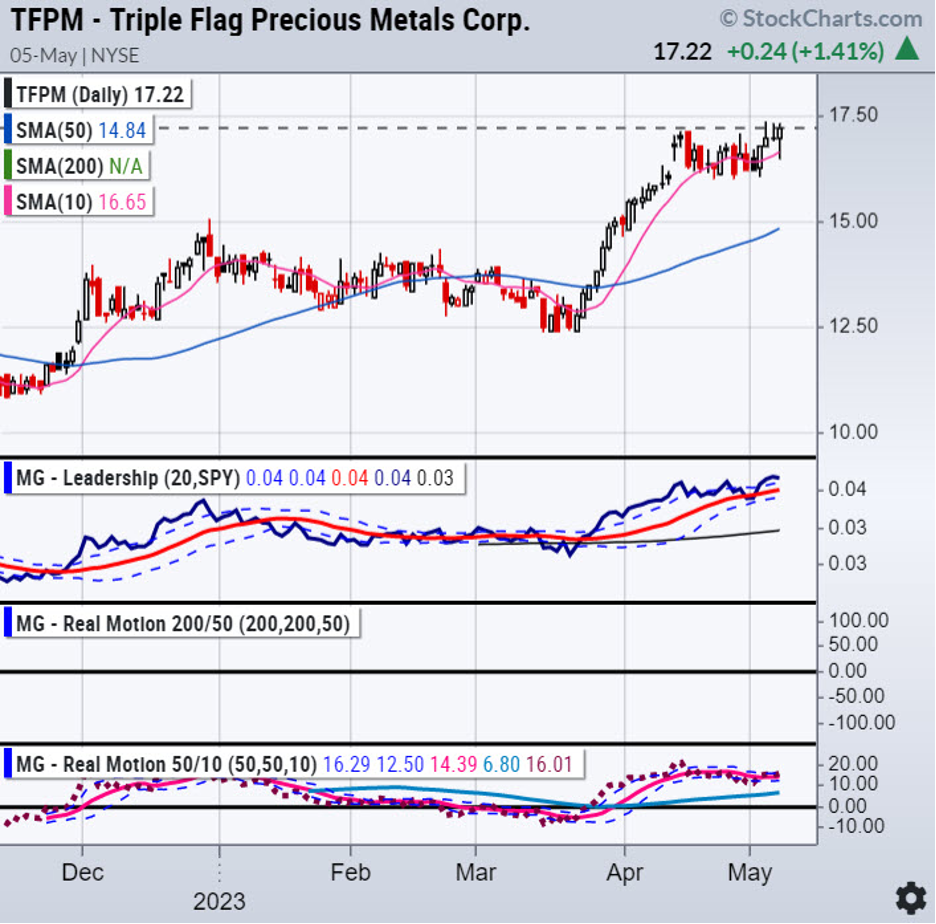
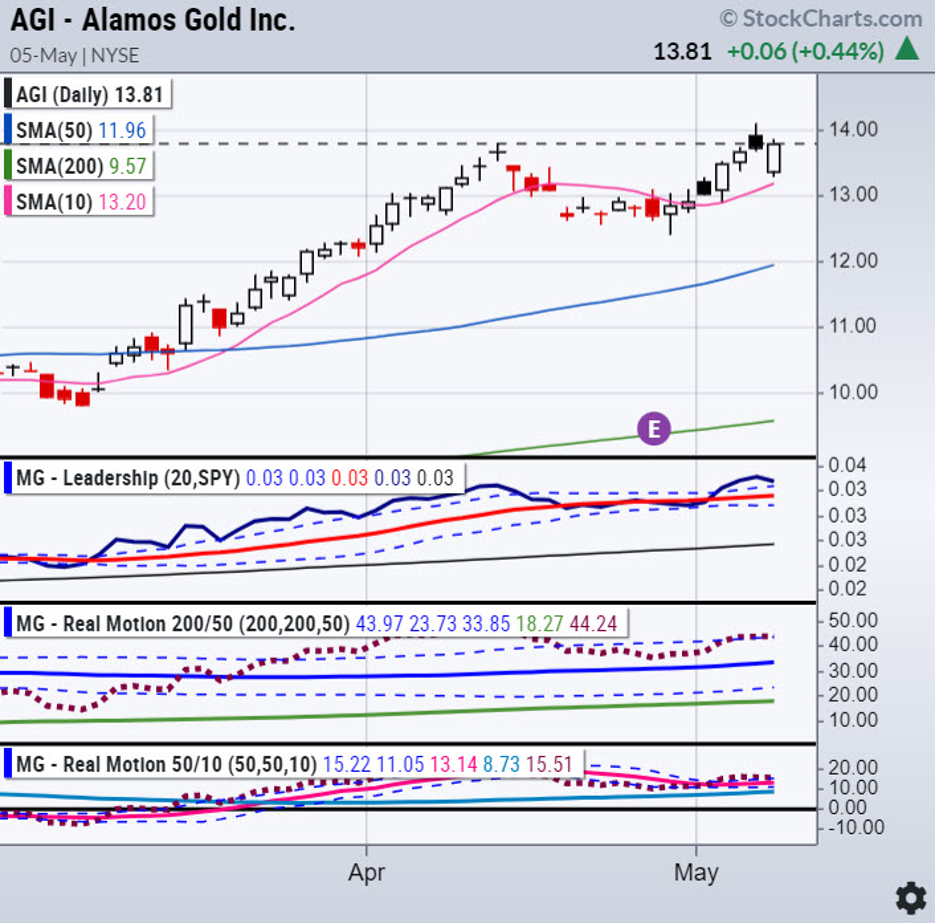
Here are a few gold stocks that have bullish patterns. These stocks are in bullish patterns as long as they stay over their 10-day moving average (red line).
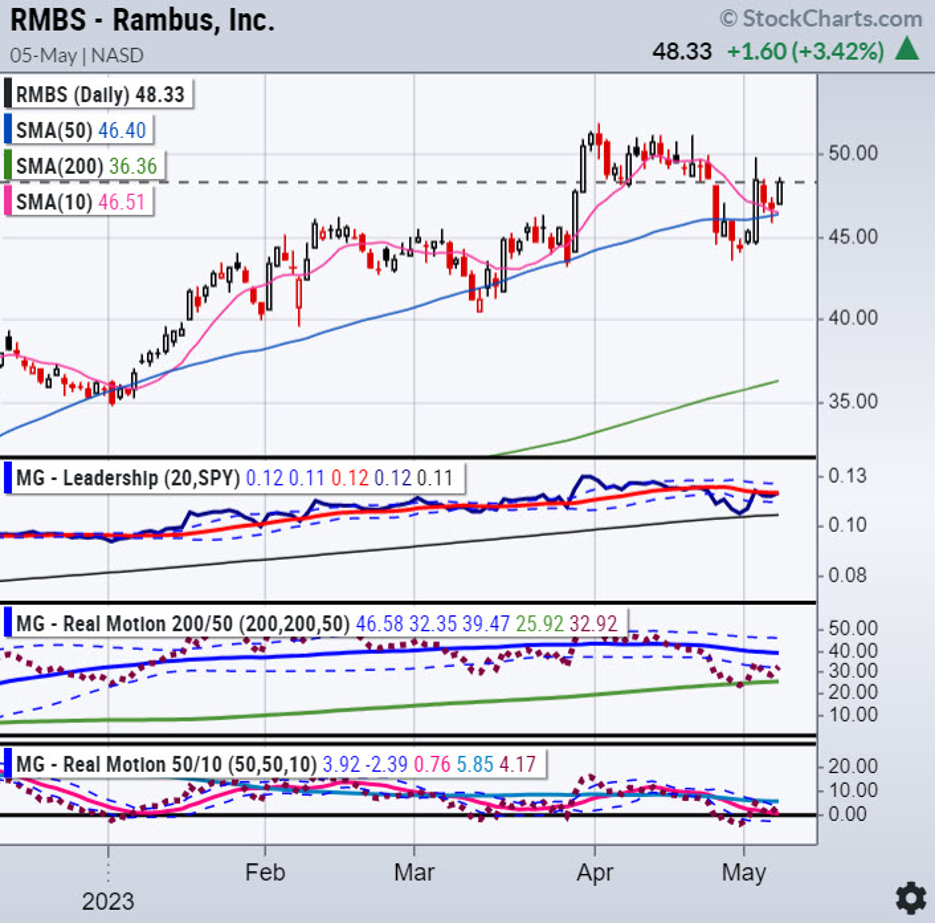
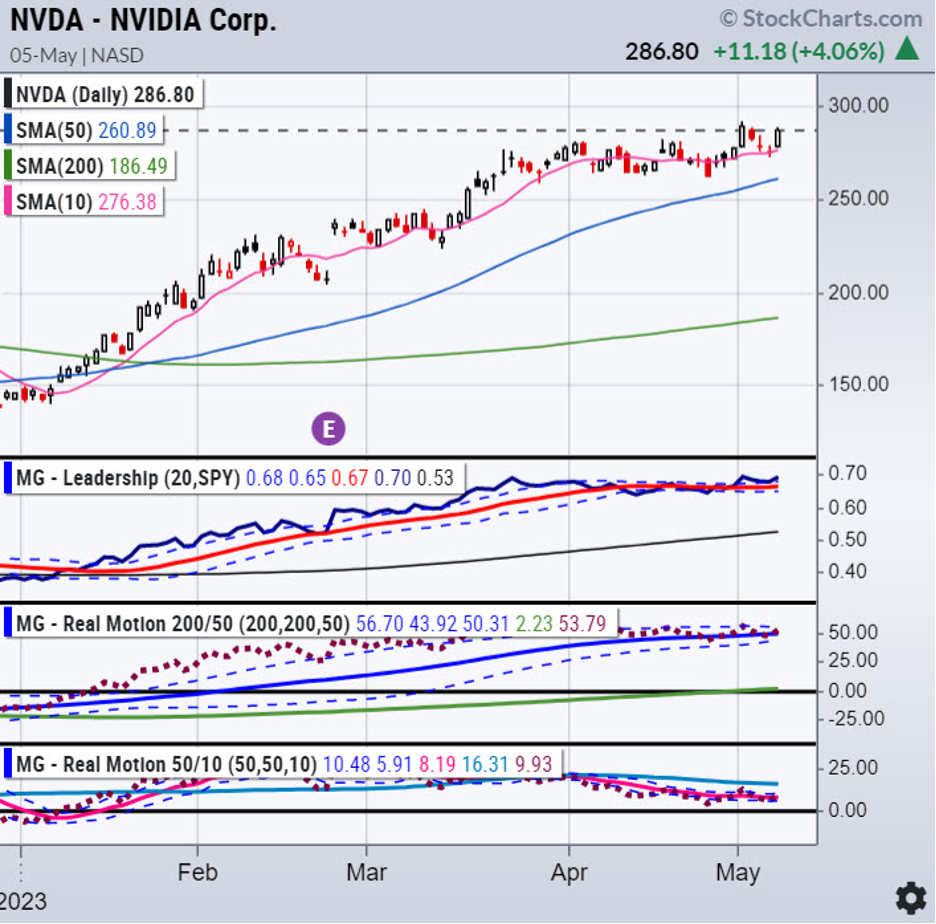
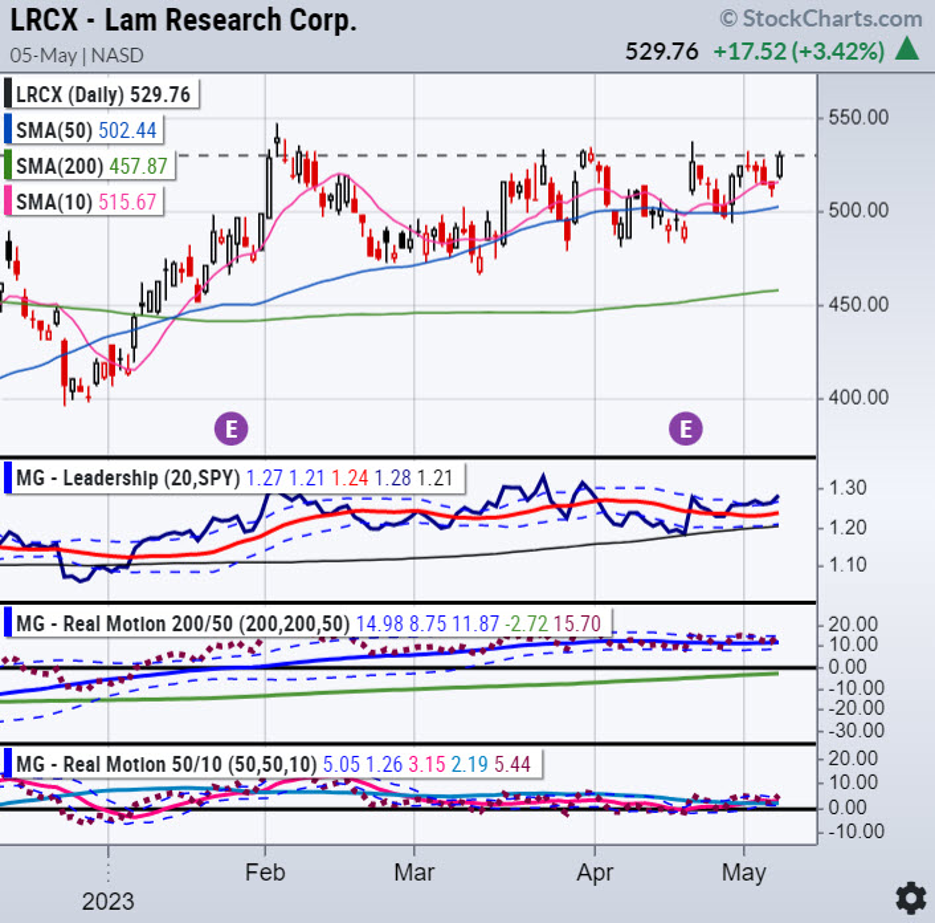
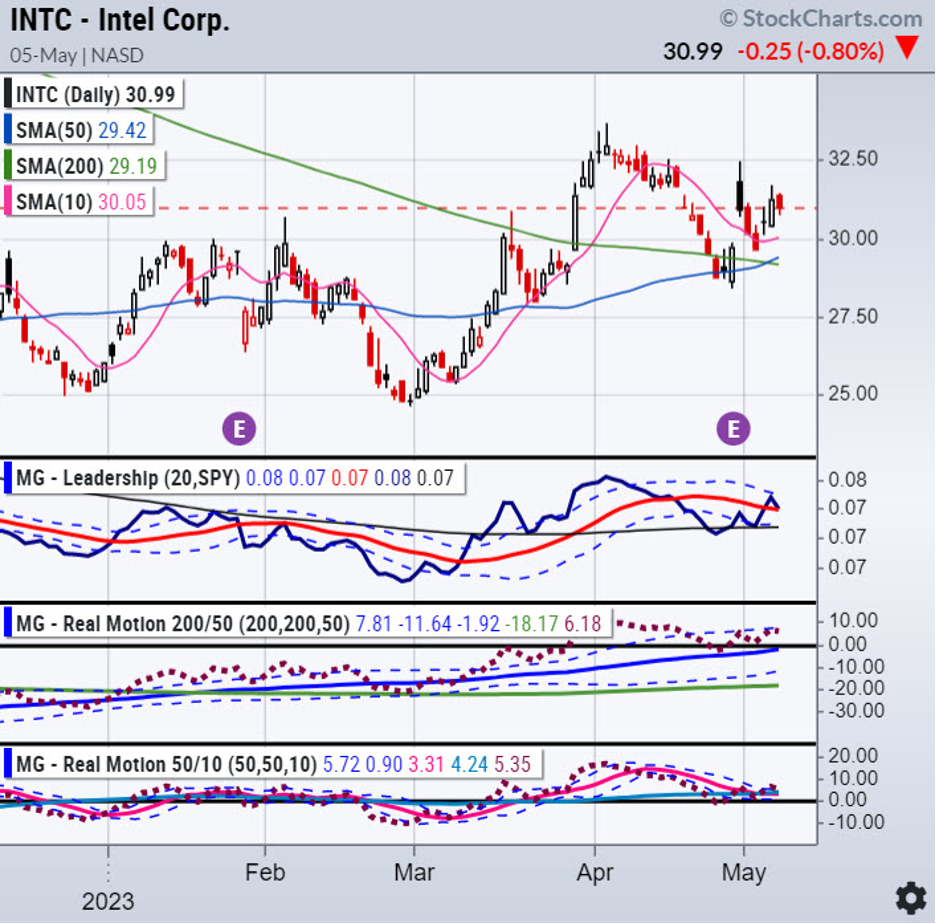
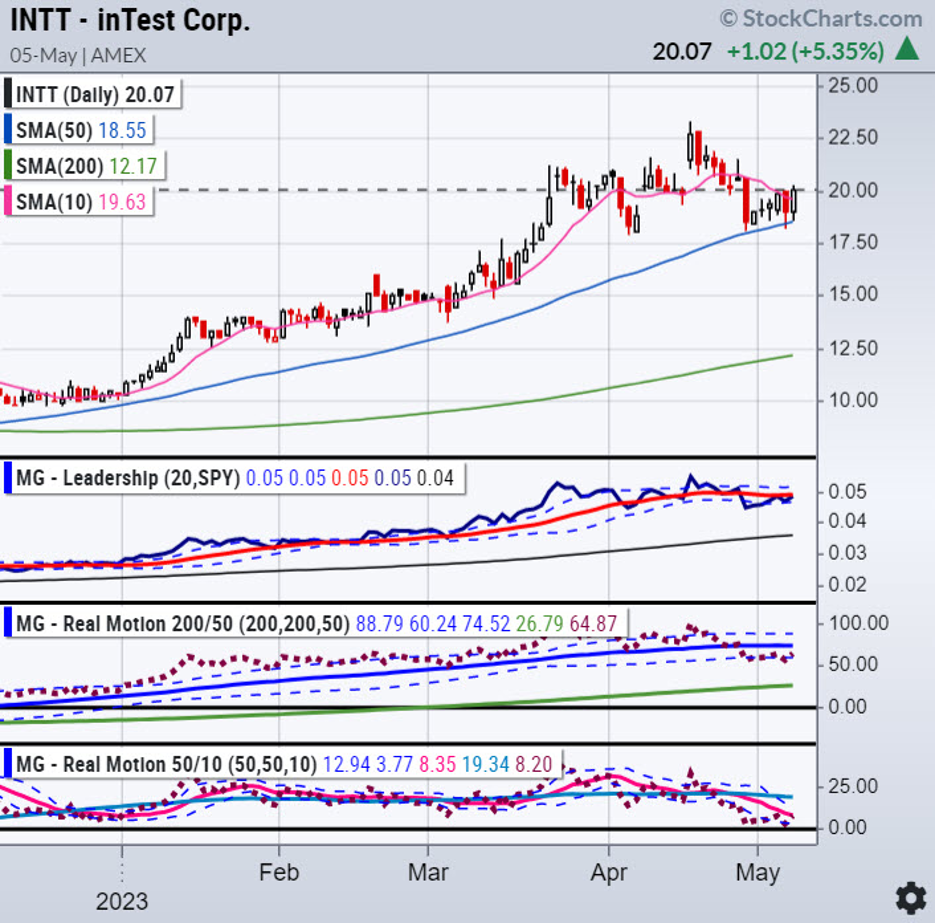
Here are some bullish semiconductor stocks
Warning: The semiconductor group is risky. It still needs to trade higher to confirm the resumption of its bullish trend. If any of these stocks or the SMH trade below last week’s low, it would be very bearish. However, if QQQ breaks out and SMH breaks over $125, these stocks could be market leaders.
For more detailed trading information about our blended models, tools, and trader education courses, contact Rob Quinn, our Chief Strategy Consultant, to learn more.
You don’t want to miss Mish’s 2023 Market Outlook E-available now

NOT TOO LATE Click here if you’d like a complimentary copy of Mish’s 2023 Market Outlook E-Book in your inbox.

Get your copy of “Plant Your Money Tree: A Guide to Growing Your Wealth”
Grow Your Wealth Today and Plant Your Money Tree!

“I grew my money tree and so can you!”- Mish Schneider
Mish in the Media
Patience for This Stock Pick 05-01-23
Into Resistance – How To Trade It 04-02-23
TD Ameritrade Nicole Petallides 04-28-23
Business First AM Angela Miles 04-27-23
Making Money With Charles Payne 04-27-23
Stock Charts 04-21-23
Benzinga PreMarket Prep 04-20-23
Cheddar TV Closing Bell 04-19-23
The Money Show-Intro to Talk 04-19-23
CMC Market Tesla, Gold, Oil, Gas, China 04-19-23
Business First AM on Tax Season 04-18-23
Final Bar Stockcharts Dave Keller 04-13-23
Twitter Spaces Wolf_Financial Former Pit Traders 04-13-23
CMC Markets 04-12-23
Yahoo Finance 04-12-23
Special Webinar on What Traders Can Expect in 2023 with Bob Lang and Mish 04-11-23
Rosanna RoPodcast 04-07-23
Making Money with Charles Payne 04-06-23
Coming Up:
May 2-5 StockChartsTV Market Outlook
ETF Summary
S&P 500 (SPY) 23-month MA 420
Russell 2000 (IWM) 170 support – 180 resistance
Dow (DIA) Over the 23-month MA-only index
Nasdaq (QQQ) 329 the 23-month MA
Regional banks (KRE) 43 now pivotal resistance
Semiconductors (SMH) 246 the 23-month MA
Transportation (IYT) 202-240 biggest range to watch
Biotechnology (IBB) 121-135 range to watch from monthly charts
Retail (XRT) 56-75 trading range to break one way or another
20230507