Mean Reversion in FAANG Stocks

Mean Reversion in FAANG Stocks – NFLX Over MSFT As Stocks Struggle
It was a pleasure to join Dale Pinkert on the FACE webinar this week, where we discussed some of the dominant technical themes at play. We talked about the breadth deterioration and how that lines up with previous bull market tops, and how the long-term picture relates to the short-term negative price action.
There is no doubt that the equity markets have been in distribution mode in recent weeks, and in fact have been in a “stealth correction” since April/May. Although the S&P 500 made new all-time highs into early September, many individual stocks are down over ten or twenty percent from their own 2021 highs!

Given the bearish breadth readings as well as the seasonal weakness in September and October, it seems likely that the short-term downtrend has not yet completed. We looked for and identified four conditions that would confirm a market top, and at this point all four have indeed been triggered.
So what’s next?
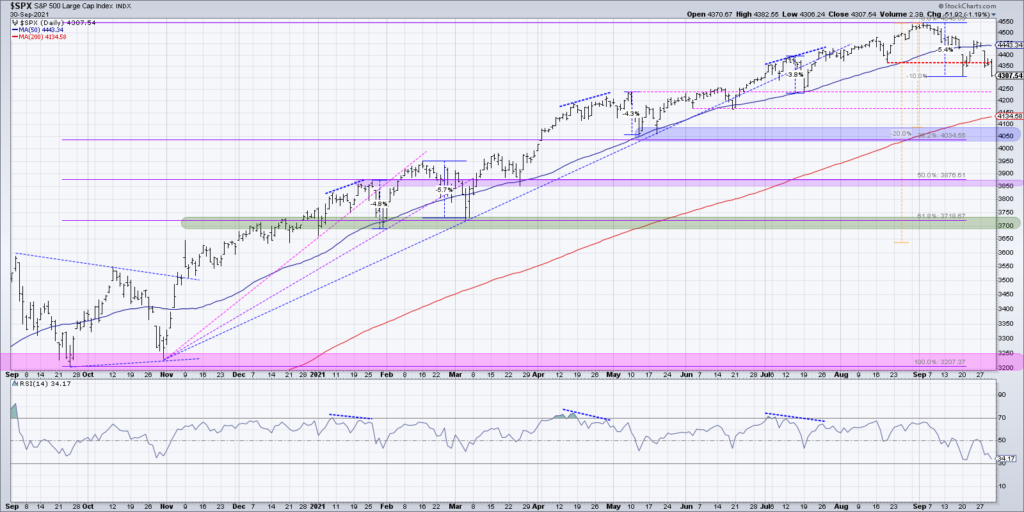
If you consider the recent action for the S&P 500 and Nasdaq 100 to be a “head and shoulders” top, with a price peak surrounded by two lower highs, then a confirmed break of the neckline would measure to around 4100 for the SPX and about 14,000 for the NDX. That would mean about another 5% lower from current levels.
For the S&P 500 chart, that would line up pretty well with both the 200-day moving average and the 38.2% Fibonacci retracement of September 2020 to September 2021 rally.
How do the FAANG stocks fit into this?
Earlier in the year, the cyclical sectors like financials and industrials were driving higher. Then in the 2nd quarter, the growth trade came up huge with mega cap technology and consumer names driving the market to new highs while the cyclicals struggled.
The leaders in that growth trade were names like MSFT and FB. Long-term uptrends continued onward and ever upward as small caps consistently underperformed.
In recent weeks, those uptrends have gone from “under pressure” to “confirmed breakdown” based on my analysis of the charts.

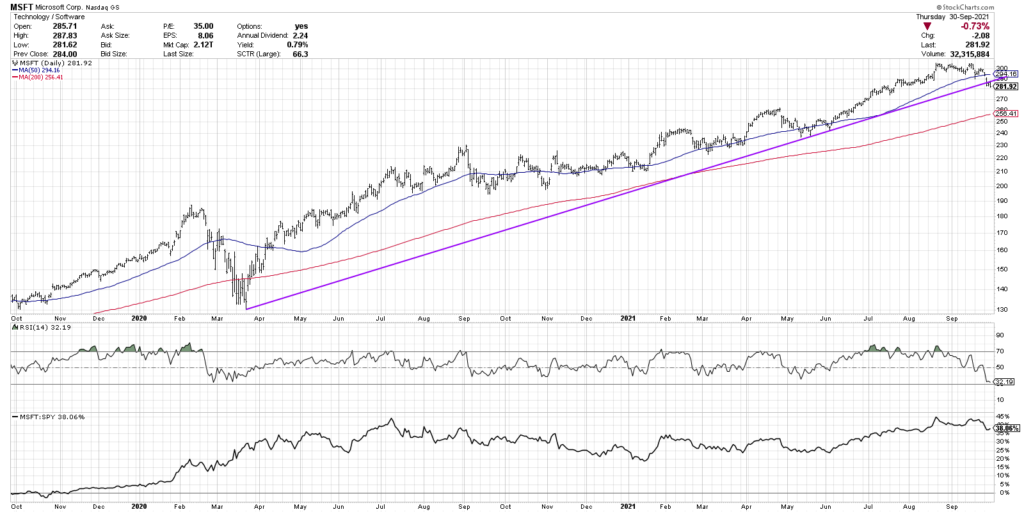
Three things concern me about the short-term dynamics for Microsoft. First, the stock broke its 50-day moving average after numerous successful pullbacks over the last 12 months. Stocks that do not hold support are likely no longer in a bullish phase.
Next, the RSI has broken below the key 40 level. This measure of price momentum usually remains above 40 in a bullish phase, as investors “buy the dips” and provide additional demand to push the price back higher. By breaking below 40, the RSI indicates that the price has rotated from a bullish phase to a bearish phase.
Finally, MSFT has now broken a long-term trendline using the March 2020 and May 2021 lows. Short-term trendlines have short-term implications. Long-term trendlines can have long-term implications!
How does that compare to NFLX, perhaps the biggest laggard of the FAANG group?

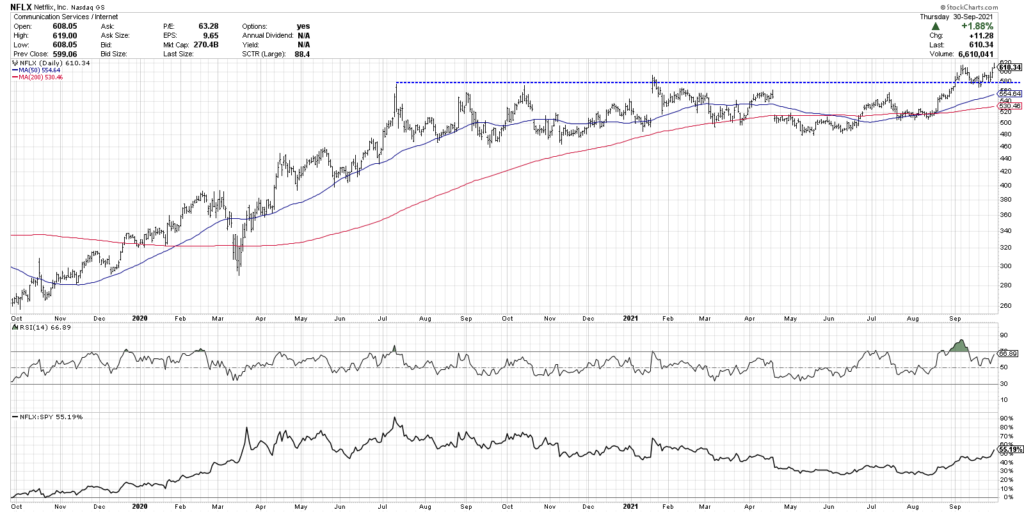
Here we see a stock chart pattern breaking out of a 15-month base, with the August rally pushing Netflix above the 580 level. The stock then pulled back in mid-September before bouncing off $580 which has now become support. As long as the price remains above 580, this chart remains in a bullish phase with improving relative strength.
What does the long-term picture hold for stocks?
There are plenty of catalysts for further upside in the equity markets. And the recent rise in yields and higher oil prices have greatly improved the technical profile of stocks in sectors like financials and energy.
I would not be surprised to see 2021 finish in a position of strength, with the market moving to new highs.
However, I would be very surprised if the markets do not see a further correction in terms of price, time, or both, before we get to those new highs.
For deeper dives into market awareness, investor psychology and routines, check out my YouTube channel!
David Keller, CMT
Chief Market Strategist
https://www.StockCharts.com
David Keller, CMT is Chief Market Strategist at StockCharts.com, where he helps investors minimize behavioral biases through technical analysis of the financial markets. He is also President and Chief Strategist at Sierra Alpha Research LLC, a boutique investment research firm focused on managing risk through market awareness. He is a Past President of the Chartered Market Technician (CMT) Association and currently serves on the CMT Curriculum and Test Committee. David was formerly a Managing Director of Research at Fidelity Investments in Boston as well as a technical analysis of the financial markets specialist for Bloomberg in New York. You can follow his thinking at MarketMisbehavior.com, where he explores the relationship between behavioral psychology and the financial markets.
Disclaimer: This blog is for educational purposes only and should not be construed as financial advice. The ideas and strategies should never be used without first assessing your own personal and financial situation, or without consulting a financial professional.
The author does not have a position in mentioned securities at the time of publication. Any opinions expressed herein are solely those of the author, and do not in any way represent the views or opinions of any other person or entity.
20211001


