Macro Tides – “Going Against the Tide”


Vaccinations are increasing at Warp Speed, Congress has approved trillions of dollars in support of those out of work and struggling small businesses, trillions more in free money for those still working, and with monetary policy remaining accommodative well into 2022, Treasury yields have soared since the end of 2020. In one of the most consensus trades in a long time, Treasury yields are expected to keep rising as the economy booms and inflation jumps. Markets however don’t move in a straight line and learning how to identify counter trend moves is an important skill set.
This piece will review the components that often appear prior to a counter trend rally and will use the analysis provided in the Weekly Technical Review (WTR) for Treasury bonds to highlight the components.
1) Market becomes over sold or over bought
2) Momentum divergence as price makes a new low or high
3) Sentiment reaches an extreme – too negative or positive
4) Inter market divergence between similar instruments in a sector
5) Market fails to respond to news
In the March 1 WTR I noted that the weekly RSI for the Treasury bond ETF (TLT) had fallen below 30 for only the fourth time in the past decade. “Since 2012 the Weekly RSI for TLT has dropped to 30 on four occasions. In June 2013 after the Taper Tantrum, December 2016 after President Trump won the election and bond holders were worried about his promised tax cut. TLT’s RSI fell below 30 in October 2018 after the bond market was distressed about rate increases by the Federal Reserve. The fourth time is last week.”
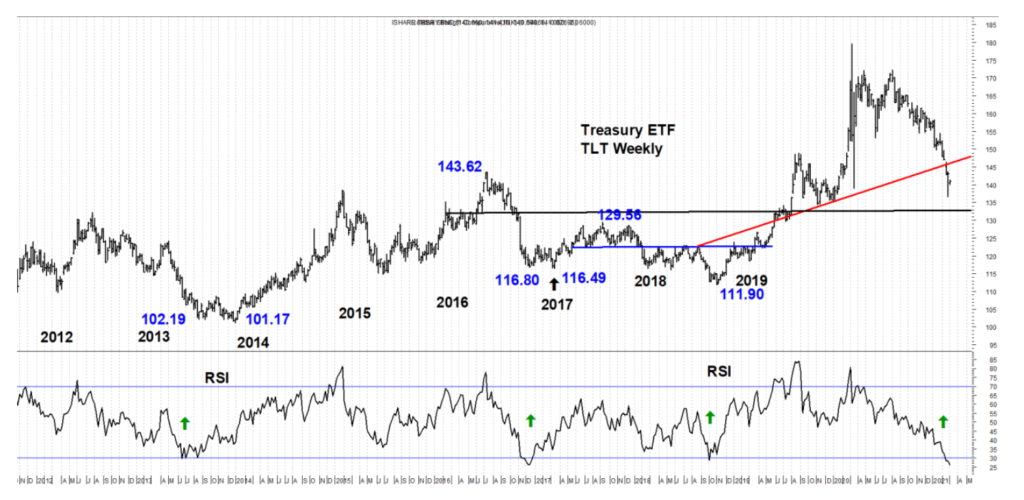
The deeply oversold level TLT had reached suggested that a trading low was approaching. In the March 8 WTR I discussed why TLT was likely to drop below the February 25 low of $136.61. “The longer term Treasury ETF (TLT) is expected to fall below the February 25 low of $136.61 in its wave 5. From June of 2019 until mid January 2020 TLT traded above and below $135.00 so this should provide significant support.”
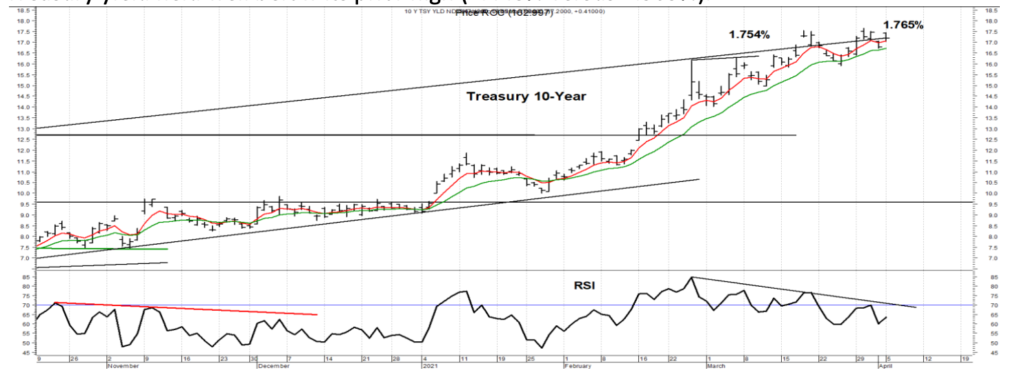
In the March 22 WTR I noted that on March 18 TLT traded down to $133.19 before closing at $133.92. TLT’s RSI recorded a significant positive divergence suggesting that TLT has bottomed and Treasury yields have topped. The last time the Weekly RSI was below 30 was in October 2018 and a similar positive divergence developed.
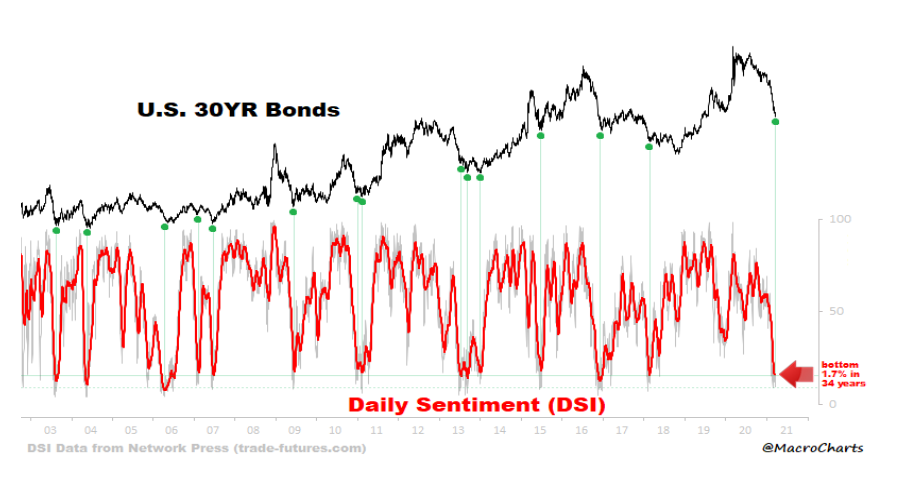
In the March 29 WTR I discussed how negative sentiment in the Treasury market had become. “Sentiment toward Treasury bonds is about as sour as it can be. The percent of bond Bulls fell to just 20% last week, according to the weekly survey of bond traders by Consensus. This is in the bottom 1.7% of all surveys during the past 34 years.”
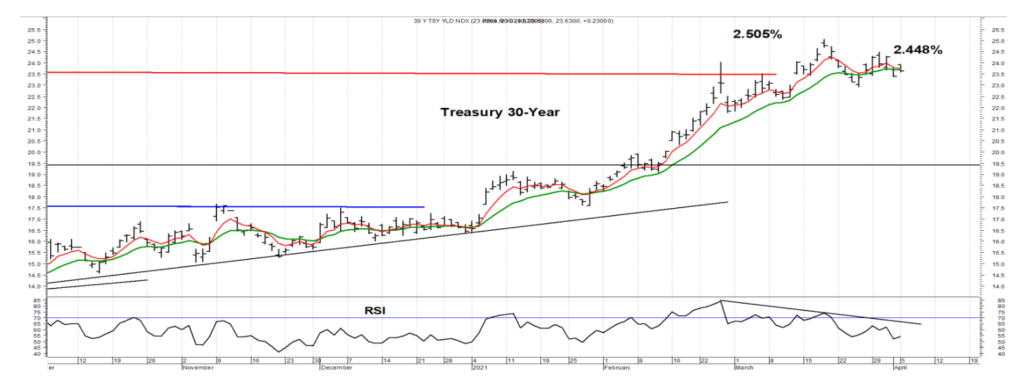
In the April 5 WTR I discussed how the Treasury market generated an inter market divergence last week as the 10-year yield rose to a higher high (1.765% versus 1.754%), while the 30-year Treasury yield held well below its prior high (2.448% versus 2.505%).
This type of inter market divergence often occurs near trend reversals, even if it is short term in nature.
On April 9 the Labor Department reported that the Producer Price Index had jumped 4.2% from March 2020 which was the largest increase September 2011. The worse than expected news on inflation failed to cause Treasury yields to rise to a higher high. The 10-year yield rose to 1.687% compared to 1.765% on March 30, while the 30-year Treasury yield popped to 2.362% and well below the prior peak of 2.505%. This suggests the Treasury bond market is sold out.
The components that would be expected to lead to a counter trend move are in place as noted in the Weekly Technical Reviews in recent weeks. In this instance the 10-year could fall to 1.50% as the 30-year drops to 2.25% at a minimum. TLT has the potential to rally to $143.00. Once this decline in yields runs its course, this counter trend move should give way to the larger trend. Treasury yields are expected to rise to higher highs in the second half of 2021.
Jim Welsh
JWelsh@SmartPortfolios.com