Key Breadth Indicator Turns Negative

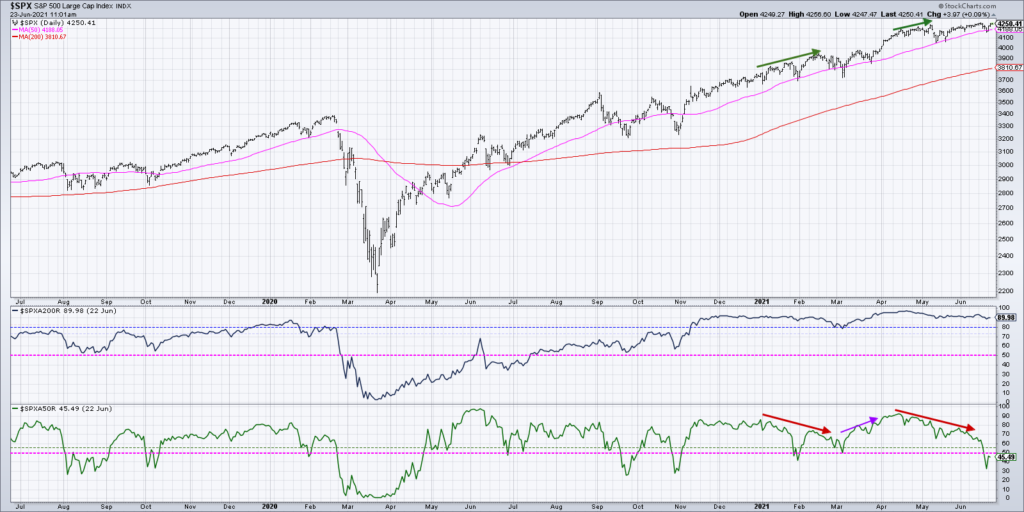
While the S&P 500 index has bounced off its 50-day moving average, many of the S&P members have already broken down through their own 50-day. Why is this chart the most important one for bulls to follow, and how can we differentiate buyable pullbacks versus deeper corrections in price and/or time?
Let’s review the chart. In mid-April, about 92% of S&P 500 members were trading above their 50-day moving average. Now fast forward to mid-June, and that number was down to about 32%.

That’s right, about 60% of the S&P 500 constituents have broken down through the 50-day moving average while the S&P itself has remained above its own 50-day pretty much the entire time!
Even as the S&P pushes upward to threaten new all-time highs, this breadth indicator still remains below the key 50% level.
In today’s video, we’ll discuss why many institutional investors use the 50-day moving average to identify actionable pullbacks. We’ll also show that by turning the 50-day moving average into a breadth indicator, we can anticipate periods of internal market weakness even as the broad market moves higher.
- * What happened when this breadth indicator had broken below 50% during previous bull cycles?
- * What can the weakening breadth conditions tell us about the character of the overall market?
- * What’s the “line in the sand” that bulls should focus on to confirm a rotation from accumulation phase to distribution phase?
For deeper dives into market awareness, investor psychology and routines, check out my YouTube channel!
RR#6,
Dave
PS- Ready to upgrade your investment process? Check out my free course on behavioral investing!
David Keller, CMT
Chief Market Strategist
www.StockCharts.com
David Keller, CMT is Chief Market Strategist at StockCharts.com, where he helps investors minimize behavioral biases through technical analysis. He is also President and Chief Strategist at Sierra Alpha Research LLC, a boutique investment research firm focused on managing risk through market awareness. He is a Past President of the Chartered Market Technician (CMT) Association and currently serves on the CMT Curriculum and Test Committee. David was formerly a Managing Director of Research at Fidelity Investments in Boston as well as a technical analysis specialist for Bloomberg in New York. You can follow his thinking at MarketMisbehavior.com, where he explores the relationship between behavioral psychology and the financial markets.
Disclaimer: This blog is for educational purposes only and should not be construed as financial advice. The ideas and strategies should never be used without first assessing your own personal and financial situation, or without consulting a financial professional.
The author does not have a position in mentioned securities at the time of publication. Any opinions expressed herein are solely those of the author, and do not in any way represent the views or opinions of any other person or entity.


