“Is the Stock Market Correction Over?” – Macro Tides Weekly Technical Review November 30th 2021

Macro Tides – “Is the Stock Market Correction Over?”
The stock market was rocked on Friday November 26 when it was reported that a new COVID variant had emerged in South Africa which had already spread to a number of other countries. Global equity markets dropped sharply as investors feared there might be another shutdown. These fears were raised after Austria announced it on November 22 that it was shutting its economy down and Germany on November 23 stating it wouldn’t in response to reports it was being considered. The US and other countries responded quickly by closing borders.
It was reported that the new variant “Omicron’ has 32 mutations in the spike protein and 50 overall. Scientists have highlighted that there are 10 mutations regarding the receptor binding domain, which is the portion of the virus that makes initial contact with cells. This is why the Omicron variant could be far more infectious than the Delta variant which only had 2 mutations. What won’t be known for a number of weeks is whether Omicron is able to defeat current vaccines and whether it causes more severe infections that require hospitalizations or fatalities. Early reports out of South Africa by doctors who are treating patients is that Omicron appears to a milder variant than Delta.
Angelique Coetzee, chair of the South African Medical Association, called the symptoms associated with the new variant as “different and so mild” compared with others she’s treated in recent months. “What we are seeing clinically in South Africa and remember, I’m at the epicenter, that’s where I’m practicing, is extremely mild,” she said in an interview on Sunday November 28 on the BBC’s “Andrew Marr Show.” She said that “We haven’t admitted anyone to the hospital with the new variant. I spoke to other colleagues of mine, the same picture.”
The US stock market seemed to conclude that Heads – if Omicron turns out to mild the market will rally since the economy will be fine, Tails – if Omicron turns out to be bad the FOMC won’t increase the taper and may hold off for longer on increasing the federal funds rate in 2022, so the market will rally. This is bullish psychology at its best!
The FOMC meets on December 15 and will have more information on the nature of the Omicron variant. If the data shows that Omicron is more infectious, results in the same or more severe infections and hospitalizations, and that the current vaccines offer less protection, the FOMC will postpone any increase in their taper until the January meeting. If there isn’t yet enough data to offer clarity on the impact of Omicron, the FOMC will postpone the decision until January. Remember the decision at the November 3 meeting was to taper purchases by $15 billion in December and January and make another decision at the January meeting. Before the Omicron variant appeared on November 26, the FOMC was almost certain to increase the amount of the taper at the December 15 meeting. The only real question was by how much.
Chair Powell acknowledged on November 29 that Omicron represents a downside risk to the economy and creates uncertainty about inflation. The decision on what to do with the taper will be a game time decision on December 15. If the data shows that Omicron is indeed a milder form of Delta, the FOMC will increase the amount of the taper.
Stocks
The S&P 500 dropped -2.14% on November 26, the Nasdaq 100 lost -1.90%, but the Russell 2000 fell -3.67%. On November 29, and with investors believing the FOMC won’t increase the taper or Omicron will be mild, the Nasdaq 100 rose +2.17%, the S&P 500 was up +1.32, but the Russell 2000 lost -0.18%. On the NYSE 1858 stocks went up and 1523 fell so market breadth wasn’t strong. The breadth on the Nasdaq was far weaker with only 1994 stocks rising but 2681 stocks falling. The number of stocks recording a new 52 week high was ugly. On the NYSE, 35 stocks made a new high but 125 stocks made a new 52 week low. On the Nasdaq 346 stocks registered a new 52 week low while only 57 stocks made a new high.
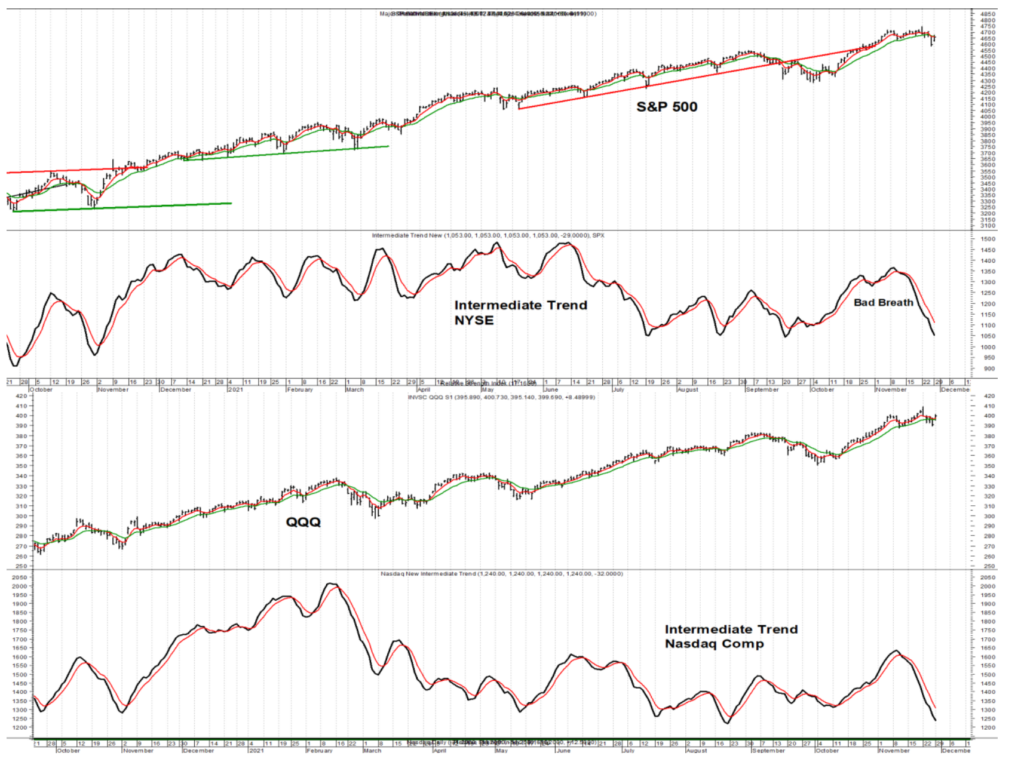
The Intermediate Trend Indicator for the NYSE and Nasdaq combines advances minus declines, 52 week highs minus 52 week lows, and up volume minus down volume. The internals of today’s rally were so weak the Intermediate Trend Indicator for the NYSE and Nasdaq continued to decline, with the Daily Indicator for both below 0.
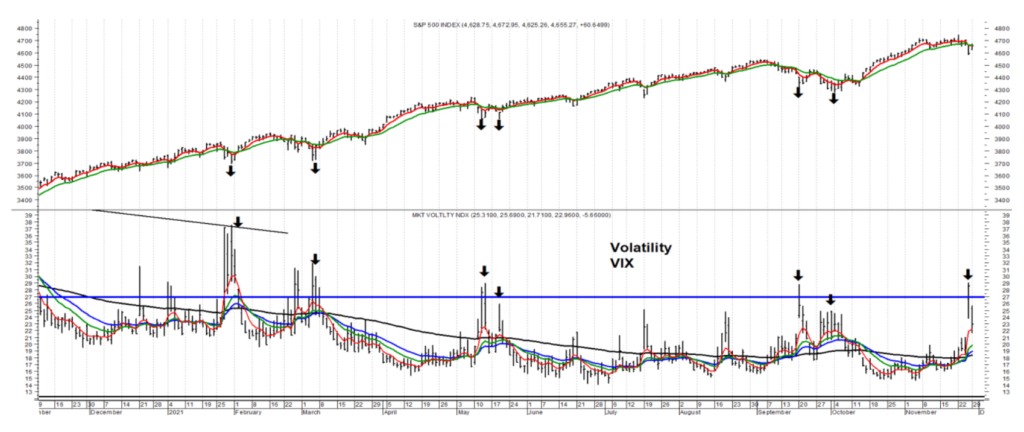
The Volatility Index (VIX) has jumped above 27.0 on 3 prior occasions in 2021 (Feb-March, May, September-October). In each case the S&P 500 rallied and then declined again with the VIX posting a lower high as noted by the second arrow in each sequence. This pattern suggests the S&P 500 is likely to experience another decline with the VIX hitting a lower high in the next two weeks.
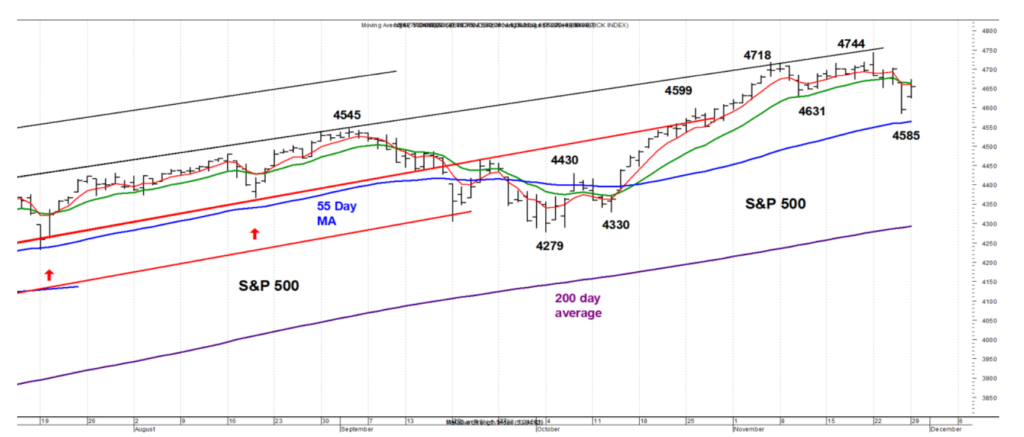
The S&P 500 topped on November 22 at 4744 and lost 159 points before bottoming at 4585 on November 26. The 61.8% retracement of this decline would allow the S&P 500 to rally to 4683. From the low at 4585 the S&P 500 opened at 4654 on November 29 for a gain of 69 points. The S&P 500 then pulled back to 4625 before rallying to the high of the day at 4673. If this second rally is equal to the first rally of 69 points, the S&P 500 could move up to 4694 and not much above the 61.8% retracement. Despite the rally on November 29 the 5 day MA didn’t cross above the 13 day MA, so that relationship is still negative.
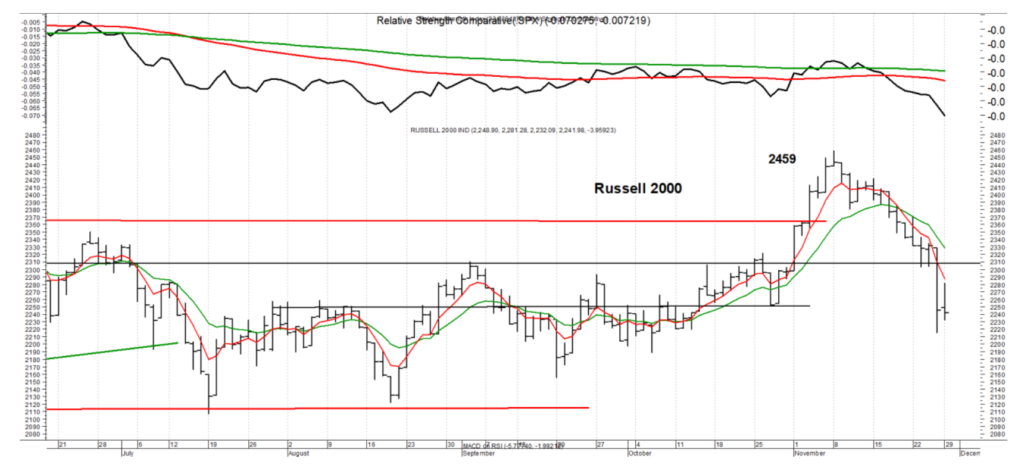
At the opening of trading on November 29 the Russell 2000 was up +1.55%, but by the end of the day closed down -0.18%. This is not good trading action and suggests there is more selling to come. Since its high on November 8 the Relative Strength of the Russell 2000 to the S&P 500 has weakened considerably.
If the S&P 500 does rally to the 61.8% retracement at 4683, an equal decline matching the drop of 159 points from November 22 to November 26 would bring the S&P 500 down to 4524. If the S&P 500 closes above 4710 it is likely to rally to a new high, although this seems like the lesser probability. In the not too distant future the first Omicron case will be reported in the US.
Treasury Yields
In the November 15 and November 22 WTR’s the expectation was that the 10-year Treasury yield would climb above the prior high of 1.691% but not move above the March high of 1.765%. The 30-year Treasury yield was expected to hold below its prior high of 2.177% while the 10-year hit a higher high. This would set up another inter market divergence and signal that yields were likely to fall. More info on this – https://www.youtube.com/watch?v=xipAohVnw40
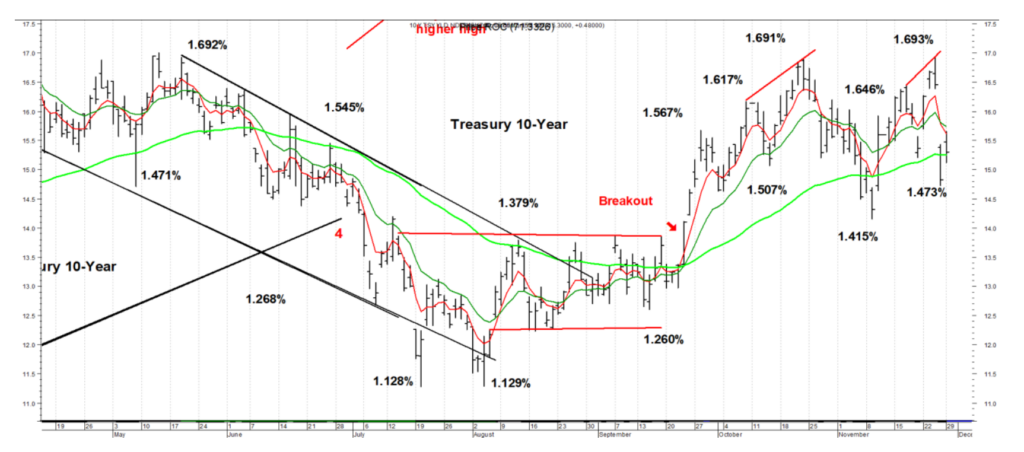
On November 24 the 10-year yield reached 1.693% before reversing lower and plunging to 1.473% on November 26 after the Omicron news. The 30-year Treasury yield only rose to 2.036% on November 24 and way below the high of 2.177% in October. On November 26 the 30-year dropped to 1.823%.
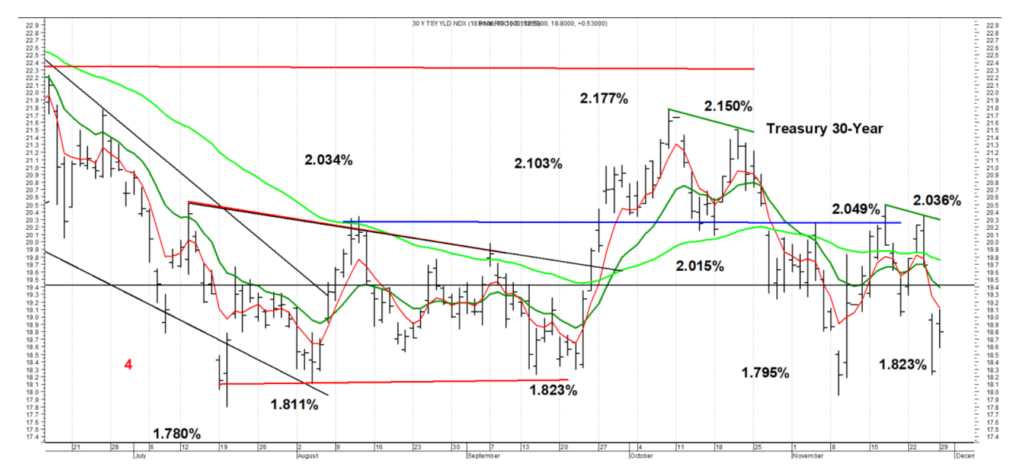
Treasury yields are unlikely to go up much in the near term as long as the 10-year doesn’t close above 1.57% and the 30-year remains under 1.95%. There is a good opportunity to short Treasury bonds coming. We’re just not there yet.
Dollar
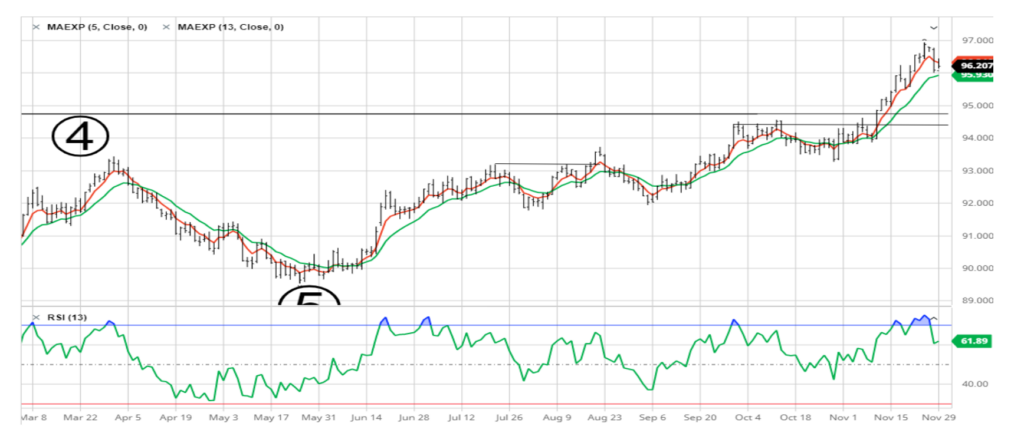
The Dollar was expected to establish an important low in late May and early June and has rallied 7% in the last 5 months. The Dollar is expected to rally to 100.00 in 2022. In the short term the Dollar has been stronger than expected but is still likely to pull back to 94.50 -94.75 which was the most recent breakout level. (See horizontal lines on chart)
Gold
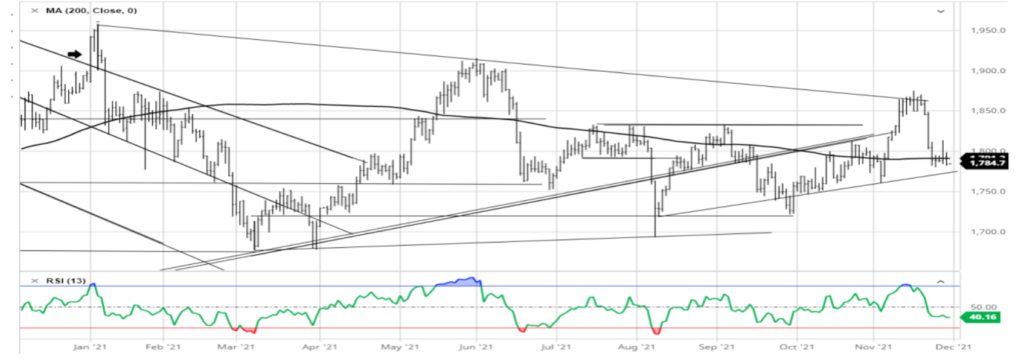
Gold sold off sharply after President Biden renominated Jay Powell as the Chair of the FOMC. The logic was a bit shady as Brainard was considered to be more dovish than Powell so Powell’s renomination meant monetary policy would be more hawkish under Powell. Huh? Powell has been the Chair as the FOMC abandoned the Phillips Curve, after using it to guide policy for 40 years, so policy would remain extremely accommodative even when the Unemployment Rate fell to 3.5% in 2019. Powell announced in August 2020 that the FOMC had adopted Average Inflation Targeting (AIT) which would allow the Core Personal Consumption Expenditures Index (PCE) to hold above 2.0% for a period of time, without a response by the FOMC. Suggesting that Chair Powell would be a hawk is a big stretch, which is why the selloff in Gold was a head scratcher.
Nonetheless, Gold dropped below $1835 (prior breakout) and then closed under $1790. Gold needs to hold the support at $1750 – $1765. The expectation is that Gold will hold above this support which will lead to another rally to near $1835.
Silver
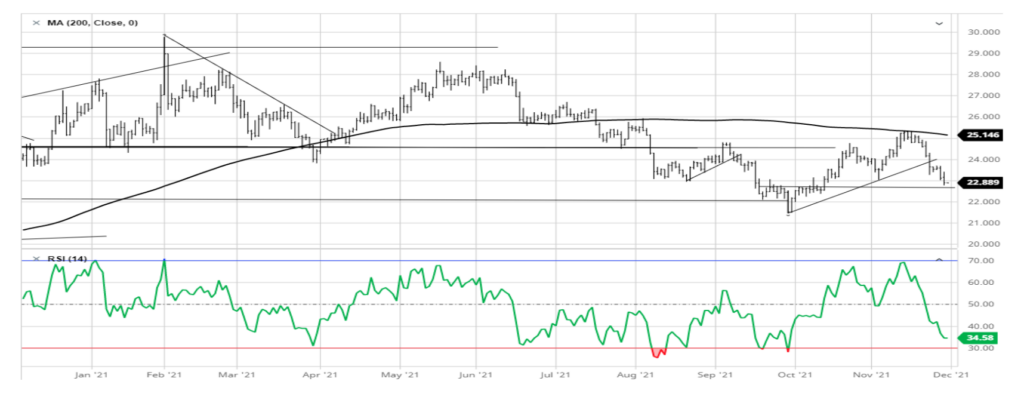
Silver failed to hold above $24.00 and needs to hold support at $22.50 – $22.70. Silver’s RSI is down to 34 so it has become modestly oversold. The expectation is that Silver will hold this support and to $24.50 with a rally to $26.00 still a possibility.
Gold Stocks
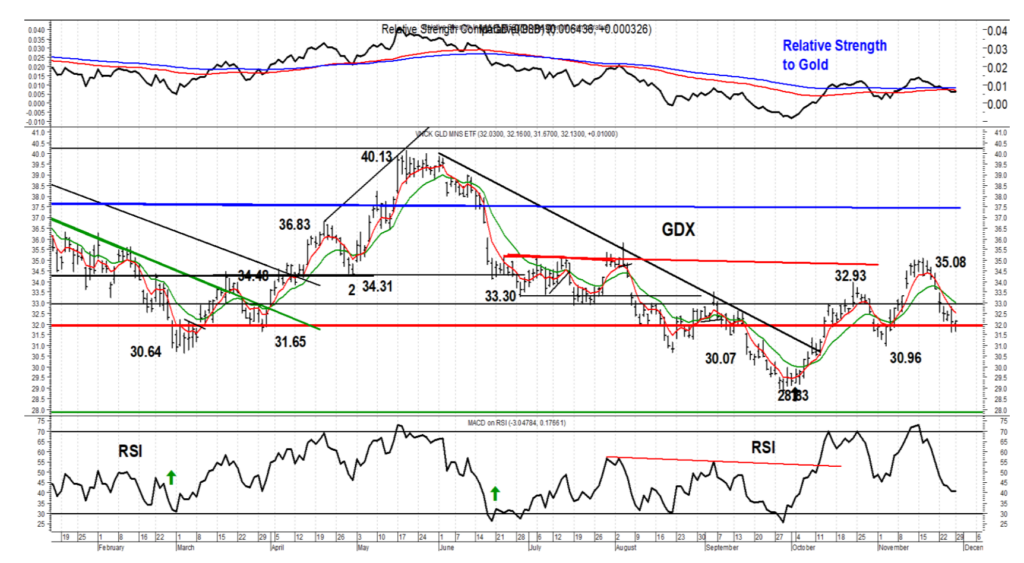
As noted last week, “GDX is expected to hold above $32.00 on this pullback. As long as GDX doesn’t close below $32.00, GDX is expected to close above $35.40 and rally to $37.00 – $37.50 in the first quarter. Buying this weakness using a close below $32.00 as a stop is recommended.” GDX traded under $32.00 on November 26 and November 29 but has yet to close under $32.00. Lowering the stop to $31.60 is recommended as GDX appears to have started basing and there could be a close slightly below $32.00 before the bas is completed. GDX continues to make higher lows and its Relative Strength to Gold is still in an uptrend. GDX is expected to rally back to $35.00. We’ll see if how it acts should GDX get to $35.00 again.
Tactical U.S. Sector Rotation Model Portfolio
Relative Strength Ranking
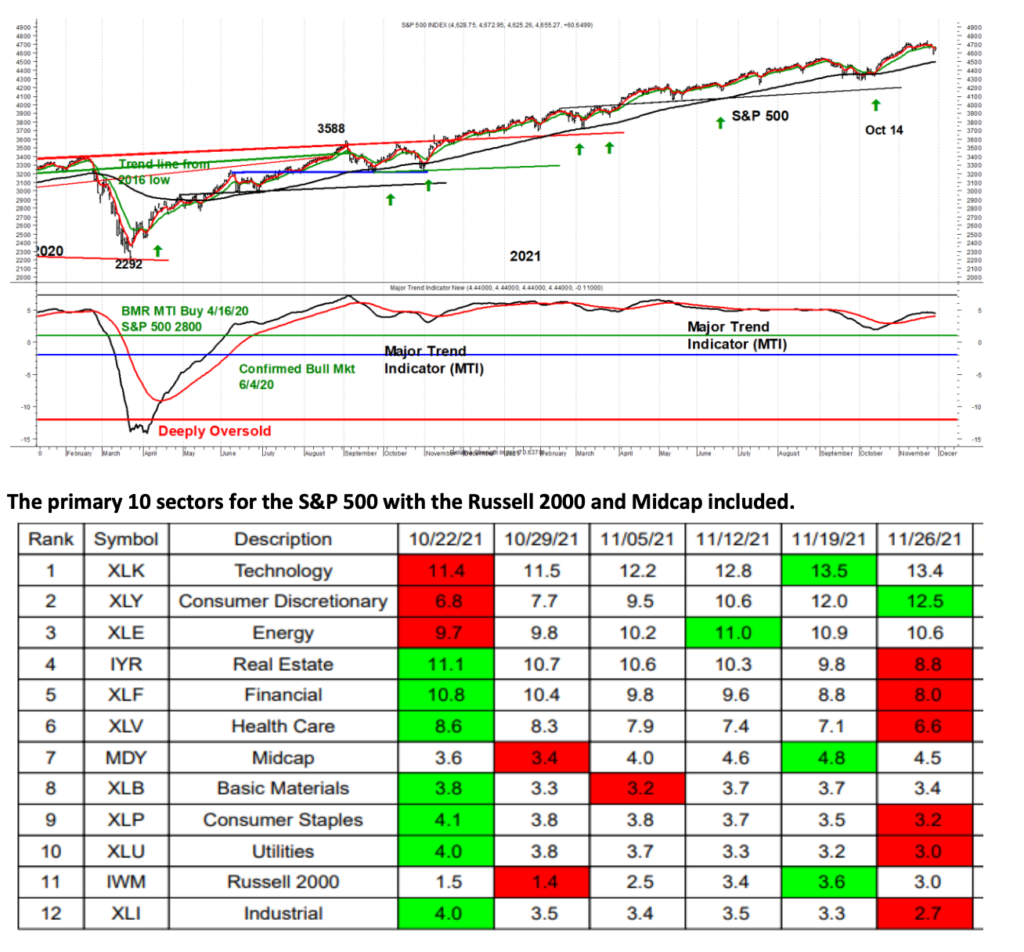
The MTI generated a Bear Market Rally (BMR) buy signal when it crossed above the red moving average on April 16, 2020 when the S&P 500 closed at 2800. A new bull market was confirmed on June 4, 2020 when the WTI rose above the green horizontal line. With the MTI still holding above the green horizontal line, the risk of a bear market is low.
The S&P 500 appears to have completed a 5 wave rally from the low of 4279 on October 4 on November 22 when the S&P 500 traded up to 4744. The S&P 500 was expected to drop below 4600 before a trading low is established. The S&P 500 fell to 4585 on November 26, but the rally on November 29 was not convincing. The S&P 500 could rally to 4683 – 4694 before the next decline takes hold. This opens up the possibility that the S&P 500 will decline below 4585 before the correction is over. The S&P 500 is expected to rally to above 4850 – 4900 in the first quarter before an important top is established.
Macrotides.com
jimwelshmacro@gmail.com
20211130


