Healthcare Relative Breakout Impressive; Small-Caps Look to be Stabilizing


| SPY- SPDR S&P 500 ETF TrustSupport: 436, 432, 429-429.50Resistance: 442, 445-6 |
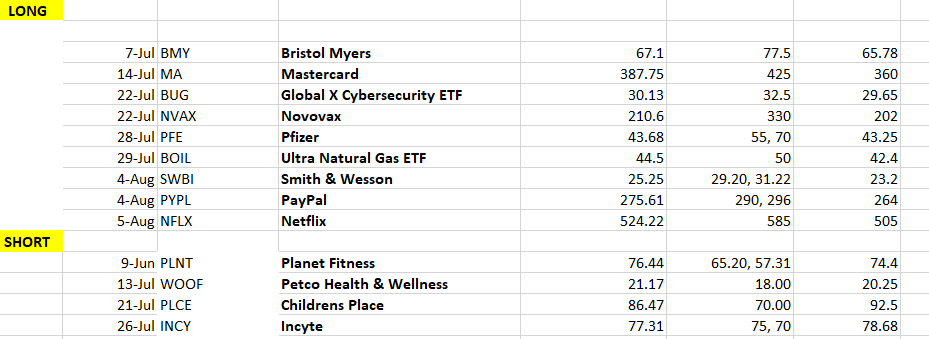
Replay to Thur Technical Webinar- 8/5- 10 Places to Position for August https://youtu.be/VQ0qXHp6kcs Wednesday Technical Video 8/4- SPX, Crude, Focus List comments https://youtu.be/OYBUIMY-8Cw Replay Link- “Cycles in SPX, TNX, DXY, Crude, Gold, Bitcoin” 7/22- Thursday Technical Webinar- 25-30 min overview https://youtu.be/rPuzfLTQjN4 SPY – (3-5 Days)- Bullish- Sideways consolidation has given way to a breakout back to new all-time highs heading into Friday’s jobs data, which should lead prices higher into the end of next week. Longs are recommended with only a move back under 436 leading to the start of more consolidation. It’s thought that a push to 445-446 is likely. FEZ (3-5 Days)- Bullish- Movement up to 48 or 48.50 in the days ahead looks likely into next week Technical Long/Short Focus list 8/6/21 |
 |
Top Technical Developments 1) S&P and NASDAQ pushed back to new all-time highs, while DJIA is close. A good result heading into important Eco data Friday and expect further gains 2) Transports, Small caps, Financials all outperformed in a wild about-face where leading sector Healthcare stumbled for once. Important if IWM gets back over 224 and next week will be a test to see if these laggards can start to push higher 3) Treasury yields should still pullback next week back to new lows and it’s right to be long Treasuries. 4) Energy sector could be bottoming and the one sector to consider a strong counter-trend stance in trying to gingerly step back into after recent weakness. it’s thought that WTI moves back to 80, so breakouts of downtrends by XLE and OIH, USO would be important and something to follow 5) Healthcare made a multi-month relative breakout vs SPY that argues for additional strength out of this group in the weeks/months to come. RYH, XLV move to new multi-day lows should prove short-lived and buyable into next week 6) Commodities like Natural Gas, Coffee, Sugar and Cotton still look quite attractive here and better choices for gains vs the Metals which have more to prove 7) DeMark signals on US indices are still not in alignment per my own methods to argue for a major market top. Further gains into end of August would indeed be more important in causing synchronicity and suggesting to sell into strength, particularly above 4500 if that occurs. 8) Cycles might be put off in turning down until September, as per my Weekly cycle composite. Most of the Daily cycles have been delayed at turning down, and it’s thought that the weekly should be given priority 9) Tech still looks to have upside, and despite being overbought, many FANG names just don’t look all that weak. Given their percentages within various ETF’s and indices, until this changes, Tech still should outperform, and markets can hold up, while Financials, Small caps, Discretionary can snap back. |
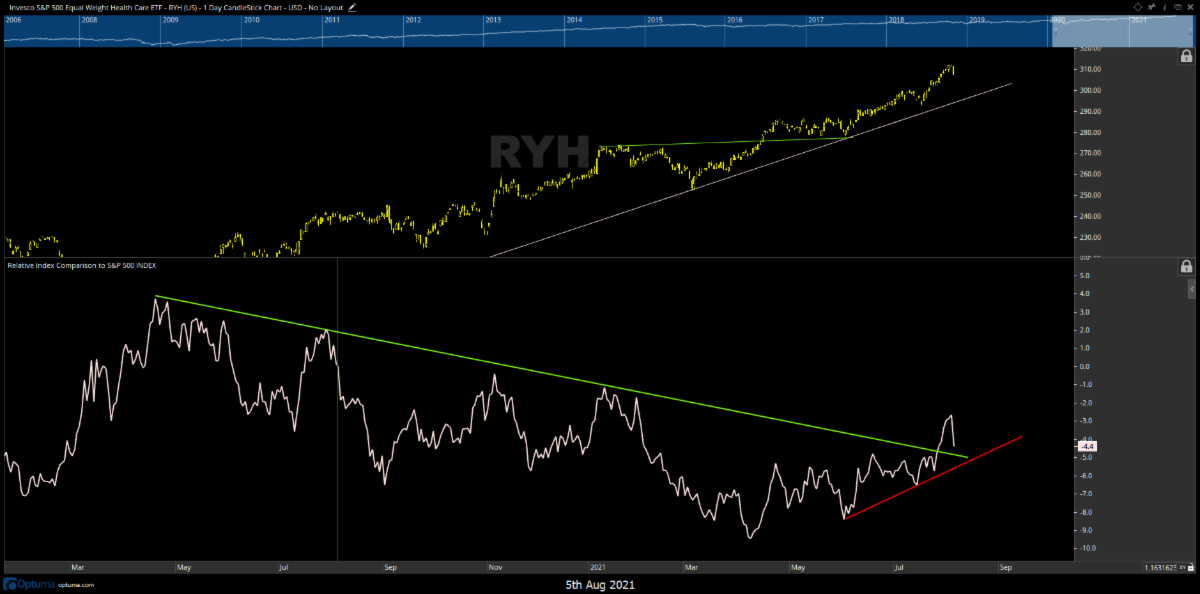 |
Healthcare’s intermediate-term breakout means pullbacks should prove buyable in the days ahead. This group remains in the upper quartile for performance over both a 1 month and 3 month basis. Pharmaceuticals and Hospital stocks have led much of this recent spike, but Thursday looked to be a day of consolidation and could lead to additional minor weakness on a 2-3 day basis. However, the key takeaway from the relative chart of RYH to SPY is that Healthcare just broke out above a downtrend going back since last April. Thus, this is the first meaningful relative strength we’ve seen out of Healthcare in more than a year. As discussed in recent weeks, Pharmas like BMY and PFE are breaking out of multi-month long bases. One should look at buying dips into next week on any further weakness, as its thought that this group should continue to offer good relative strength, and Thursday’s weakness should prove temporary given the positive relative breakout. |
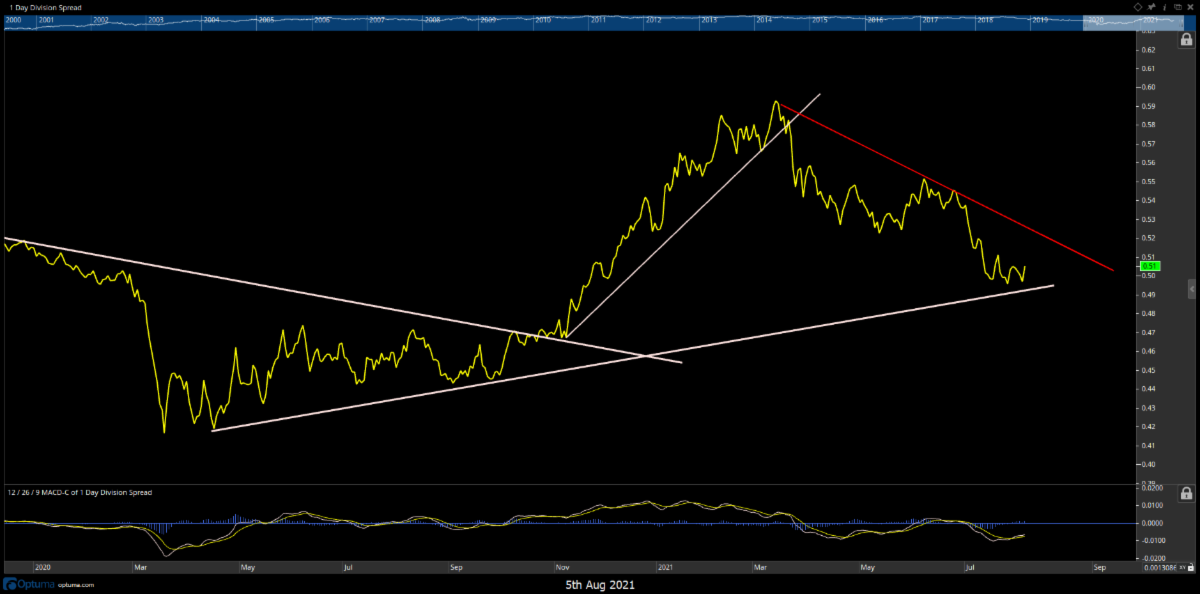 |
Small caps slowly but surely look to be trying to stabilize, but a break of the downtrend is necessary to convincingly believe in a larger IWM bounce. While IWM did in fact bottom near 208, similar to where it did back in recent months, the relative chart of IWM vs SPY has been hit hard since this peaked out in February. Specifically the period from mid-June into mid-July saw Small caps drop further out of favor and underperformed badly. However, at current levels, as can be seen on ratio charts above, this recent pullback seems to be holding at a direct area of trendline support going back since last year. Thus, traders might look to position long in Small caps with stops at 208 for IWM, while many investors should watch for evidence of this downtrend being broken on gains in the days ahead. Such a breakout likely would lift IWM back to new all-time highs, which has lagged badly in recent months. Overall the next 2-3 weeks should give lots of clues in this regard, but an appealing juncture to consider playing a bounce. |
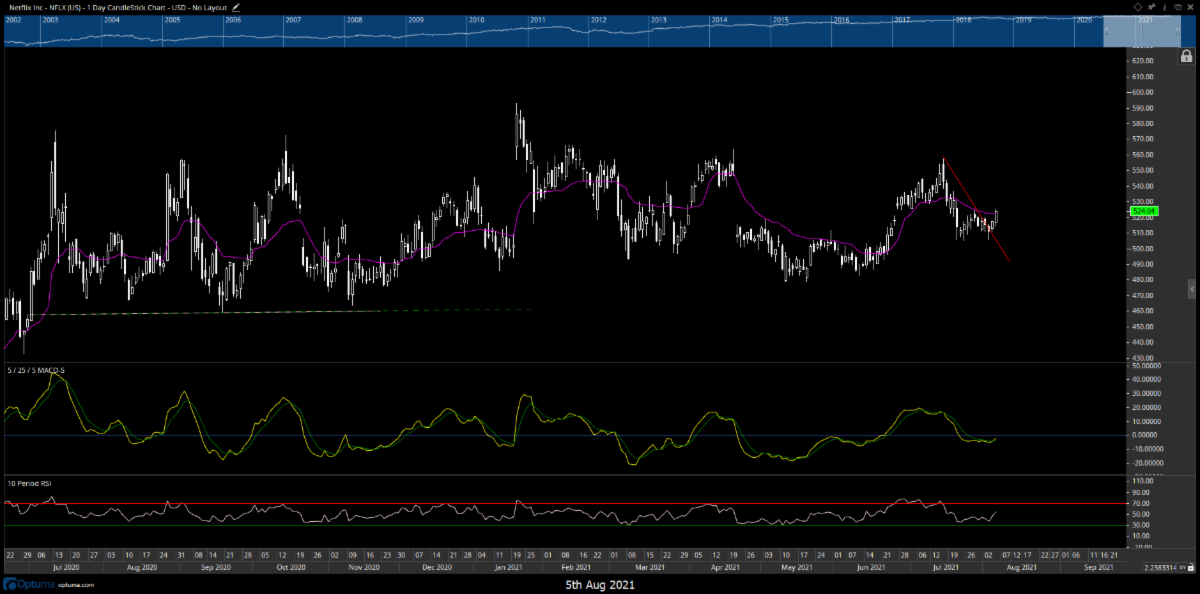 |
Netflix (NFLX- $524.22) – I am getting long NFLX here with target 585 and stop of 505-While the 1 year trend is neutral, the momentum has picked up a bit since May with rally and then minor consolidation. Now today is pushing up above last week’s highs, a constructive development near-term. Bottom line, this looks to be a similar case like we’ve seen before of a “FANG” name going into lengthy consolidation before eventually breaking back out to new highs. Given that this has been sideways for a year, the technical trend might seem a bit dull to initiate new longs. However, as said above, momentum has picked up since May when this bottomed last. Moreover, the move back to multi-day highs today above last week’s highs is a good sign technically. I’m expecting this likely can start to rally back to the highs of its range, and feel NFLX is a good risk/reward here with stops at 505. |
Mark Newton
Managing Member/Founder
ML Newton Advisors LLC
You can reach me at: https://newtonadvisor.com/
Or email me at info@newtonadvisor.com for copies of recent notes, or to inquire about how my work might fit to one’s investment process.