GOOG and Failed Breakouts


GOOG and Failed Breakouts
In bullish market phases, stocks don’t just trade to resistance, they trade through resistance. Think of 2021, when pullbacks for the S&P 500 were limited to 3-5% and every brief drop in the index soon led to another all-time high.
In bear market phases, we see stocks unable to follow-through after breaking above resistance levels. This concept of follow-through is an important one which was pounded into my head in conversations over the years with Larry Williams, Tom DeMark, and others.
Just getting a key resistance level is not enough. You need to see the market push above that level with sustained demand. Only then can you assume that the buying power that pushed the price to that level has the chance to push the price even further to the upside.
So when I see Alphabet breaking above its 200-day moving average last week for only the second time in the last 12 months, I immediately looked for confirmation. Will there be enough “gas in the tank” to propel the price even higher?
A review of the chart today suggests that may not be the case.
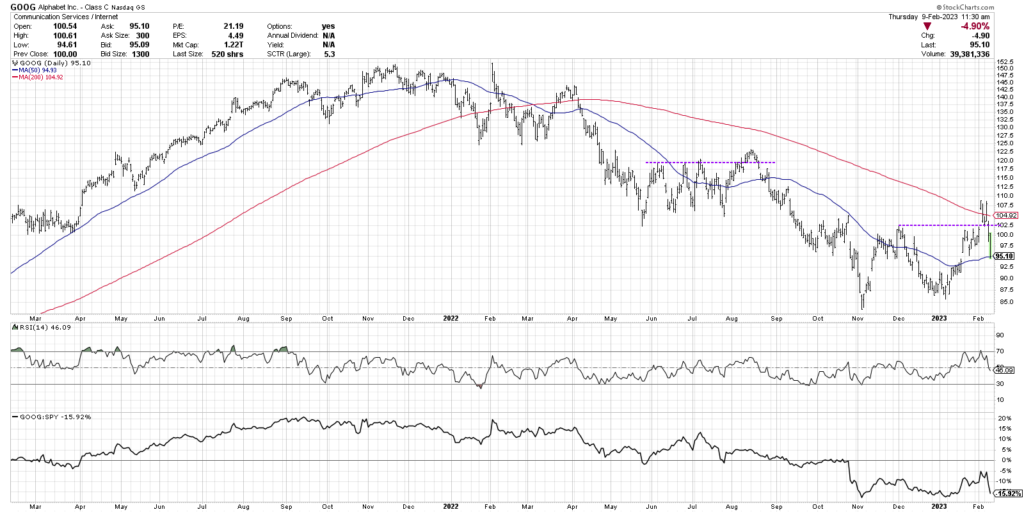
Before we consider the recent breakout, let’s review what happened back in August. The S&P 500 was testing its own 200-day moving average and GOOG was breaking to a new swing high. On the surface, this all seems rather bullish.
But about a week after breaking to a new swing high around $120, Alphabet started to roll over. The stock reached up to about $123 before rotating back below the breakout level.
I am a big fan of buying breakouts when the evidence supports doing so. I am also a very big fan of having a good stop-loss strategy in that sort of situation, so as to limit downside rise if the breakout does not hold.
About a week later, GOOG gapped down in what ended up being the beginning of a long and steady road down to its eventual low in November. So in August, we had a what’s called a “failed breakout” where an initial upside breakout lacks the follow-through and then price moves back below the breakout level.
Now look at GOOG in 2023 and you’ll find a very similar and somewhat concerning pattern. Again, we see Alphabet break to a new swing high and in this case even gets above the 200-day moving average. Seems very constructive!
But a couple days later, the price moves back below the 200-day moving average and soon after violates the breakout level around $102.50. The stock is down another 7% since that breakdown and now tests its 50-day moving average around $95.
Note how the RSI was overbought at the breakout point (check out my latest YouTube video for more info on how I use RSI in this situation!) and now the price has mean reverted lower to alleviate this overbought condition.
So what’s next for GOOG? Charles Dow taught that an uptrend is a pattern of higher highs and higher lows. I am watching to see if Alphabet can find another higher low about $87. But I’m especially watching to see if and when GOOG can get back above resistance around $102.50.
Strong charts get stronger. And Alphabet still has much to prove before it can be described as such!
For deeper dives into market awareness, investor psychology and routines, check out my YouTube channel!
RR#6,
Dave
David Keller, CMT
Chief Market Strategist
StockCharts.com
David Keller, CMT is Chief Market Strategist at StockCharts.com, where he helps investors minimize behavioral biases through technical analysis. He is also President and Chief Strategist at Sierra Alpha Research LLC, a boutique investment research firm focused on managing risk through market awareness. He is a Past President of the Chartered Market Technician (CMT) Association and currently serves on the CMT Curriculum and Test Committee. David was formerly a Managing Director of Research at Fidelity Investments in Boston as well as a technical analysis specialist for Bloomberg in New York. You can follow his thinking at MarketMisbehavior.com, where he explores the relationship between behavioral psychology and the financial markets.
Disclaimer: This blog is for educational purposes only and should not be construed as financial advice. The ideas and strategies should never be used without first assessing your own personal and financial situation, or without consulting a financial professional.
The author does not have a position in mentioned securities at the time of publication. Any opinions expressed herein are solely those of the author, and do not in any way represent the views or opinions of any other person or entity.
20230209