GoNoGo Charts – Launch Conditions (Week Ending January 22nd 2022)

GoNoGo Charts – Launch Conditions
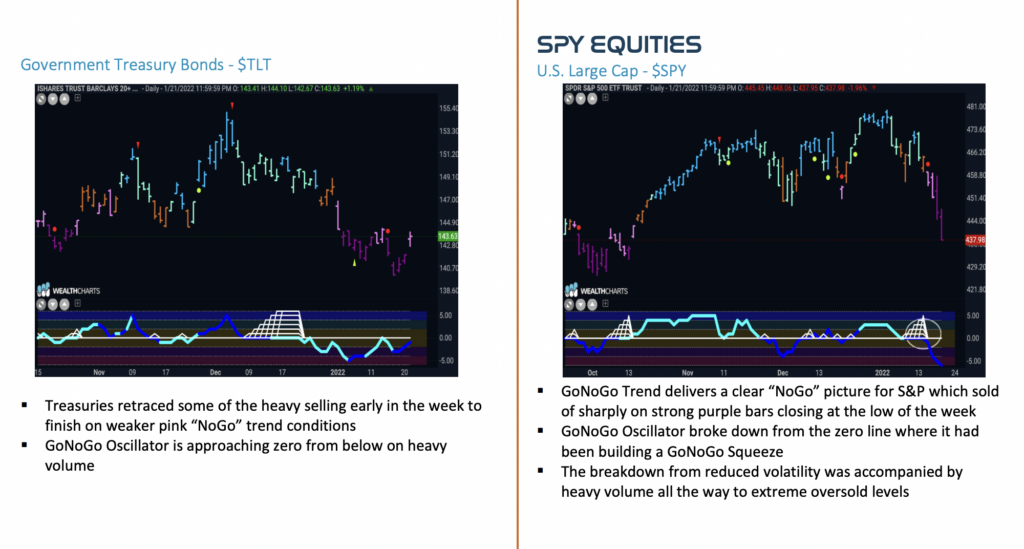
A victorious week for the bears. Demand for risk assets – in particular, high-multiple growth stocks – was absent this week. The selling pressure pushed the S&P 500 Index to its biggest decline in more than 14 months over the holiday-shortened week (US markets observed Martin Luther King Jr. Day on Monday). Notably, the lower panel of the $SPY chart below shows GoNoGo Oscillator® breaking down out of a volatility squeeze. Negative momentum readings are consistent with the dominance of sellers. The dark blue color of the oscillator line indicates heavy volume. And, it ended the week at -6, an oversold extreme for GoNoGo Oscillator.
Welcome to your weekend edition of Launch Conditions from GoNoGo Research.
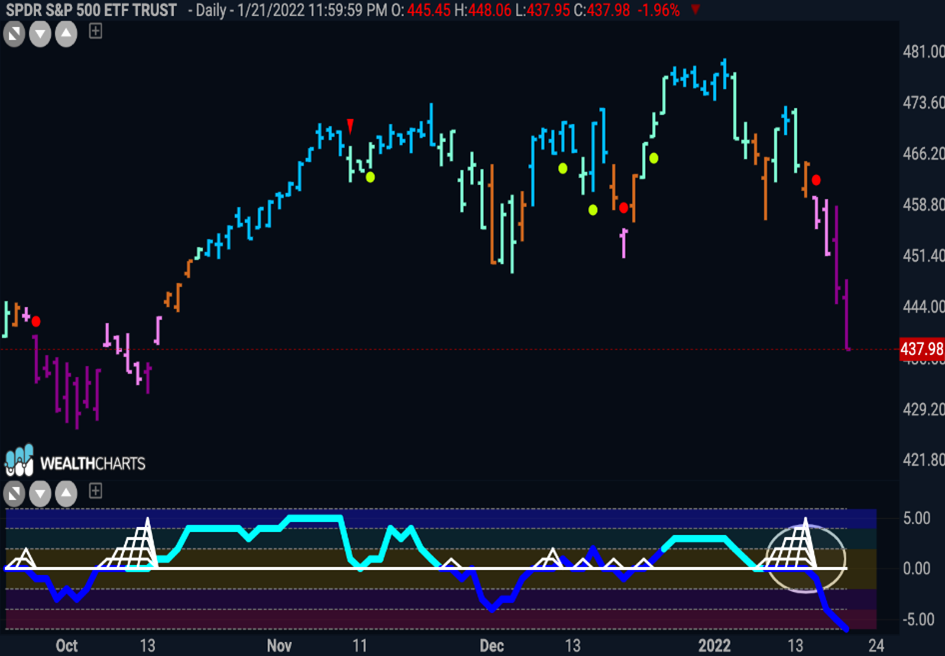
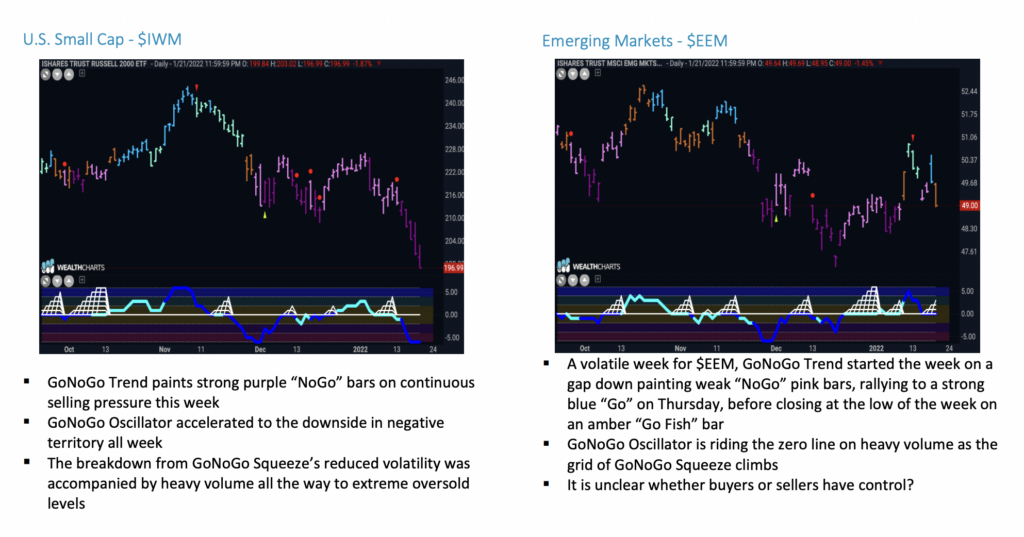
The chart pack below will provide perspective on the trends across asset classes and global markets. But first, we can put some numbers to the selling pressure this week: The Dow Jones Industrial Average fell 4.6%, the S&P 500 fell 5.7% to end the week below its 200-day moving average, the Nasdaq Composite fell 7.6% its biggest weekly drop since the start of the pandemic, and the Russell 2000 fell 8.1% approaching definitions for bear market territory.
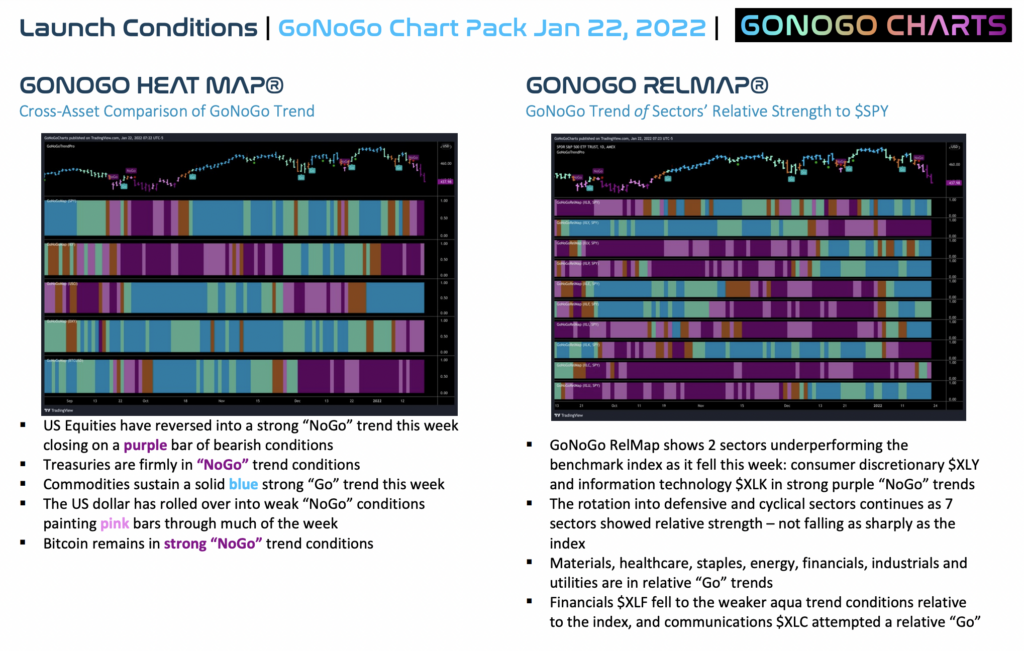
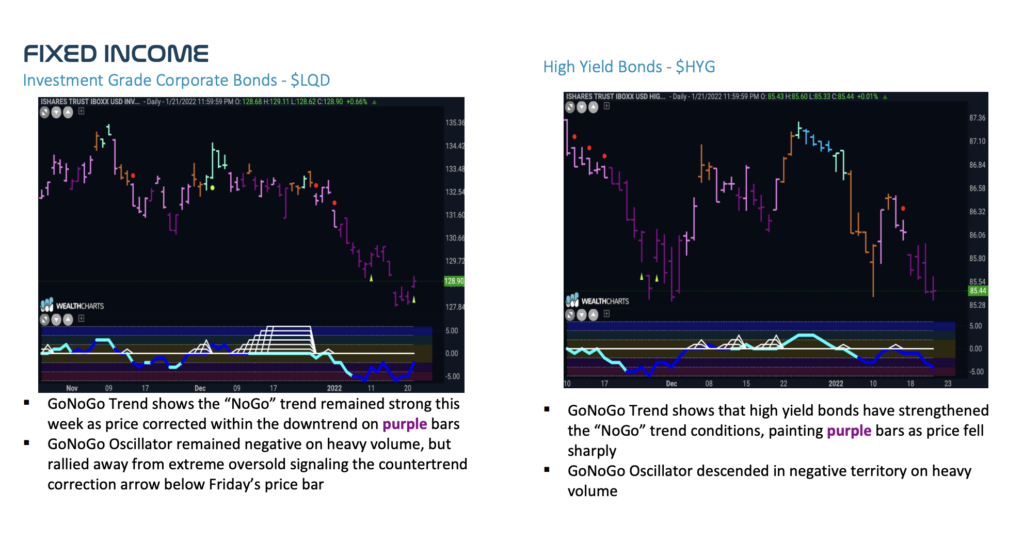
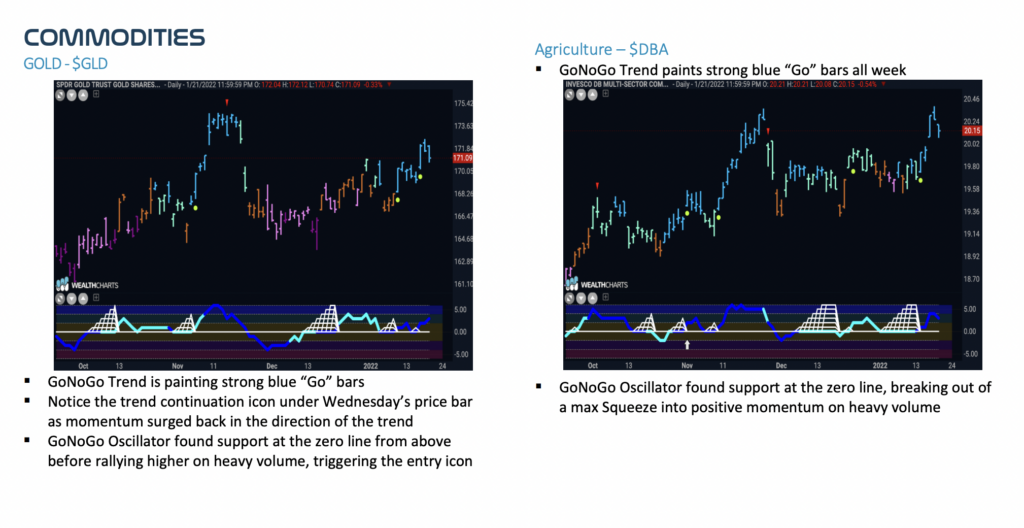
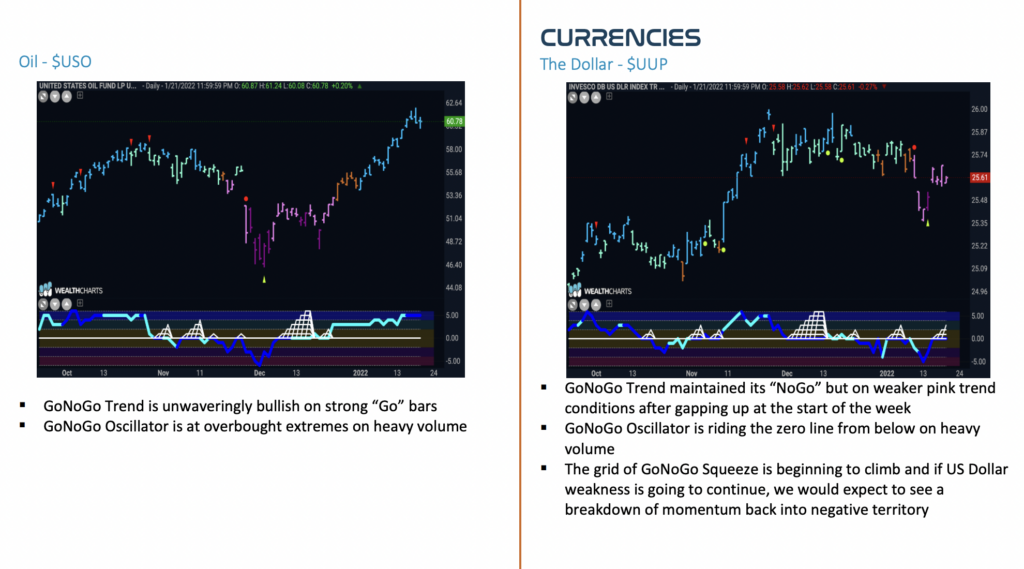
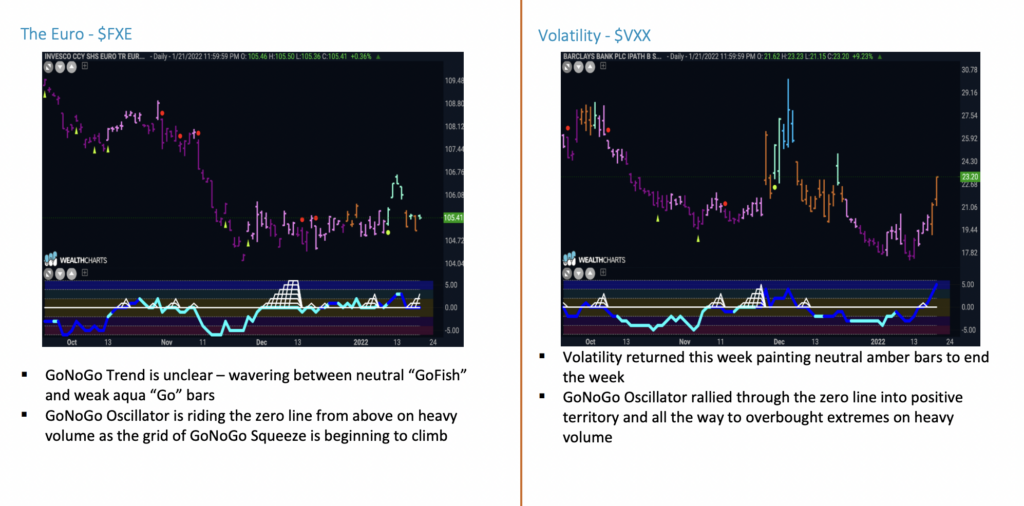
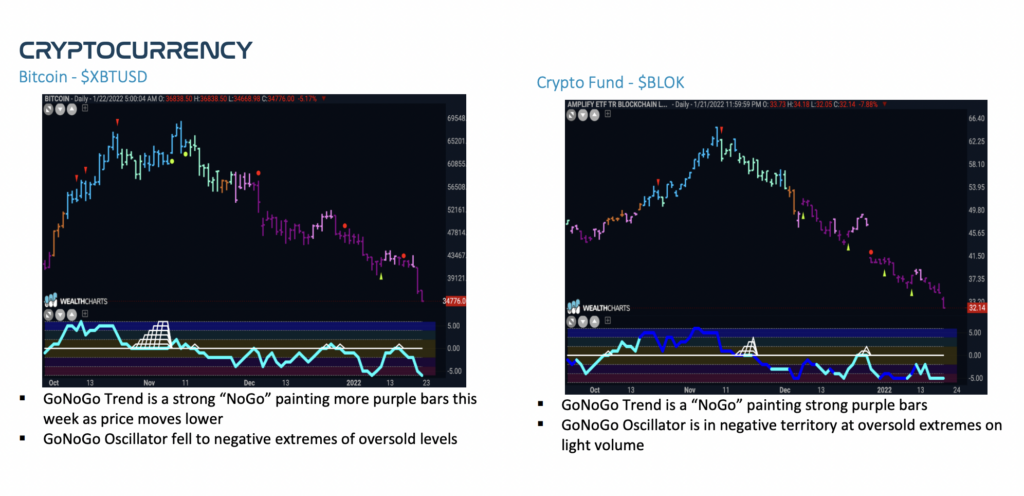
As responsible investors, we must build in practices that remove the emotional turmoil of volatile trading weeks, so that we can step back to assess the markets objectively. Take a minute to review your Launch Conditions chart pack to see the bigger picture trends:
20220122


