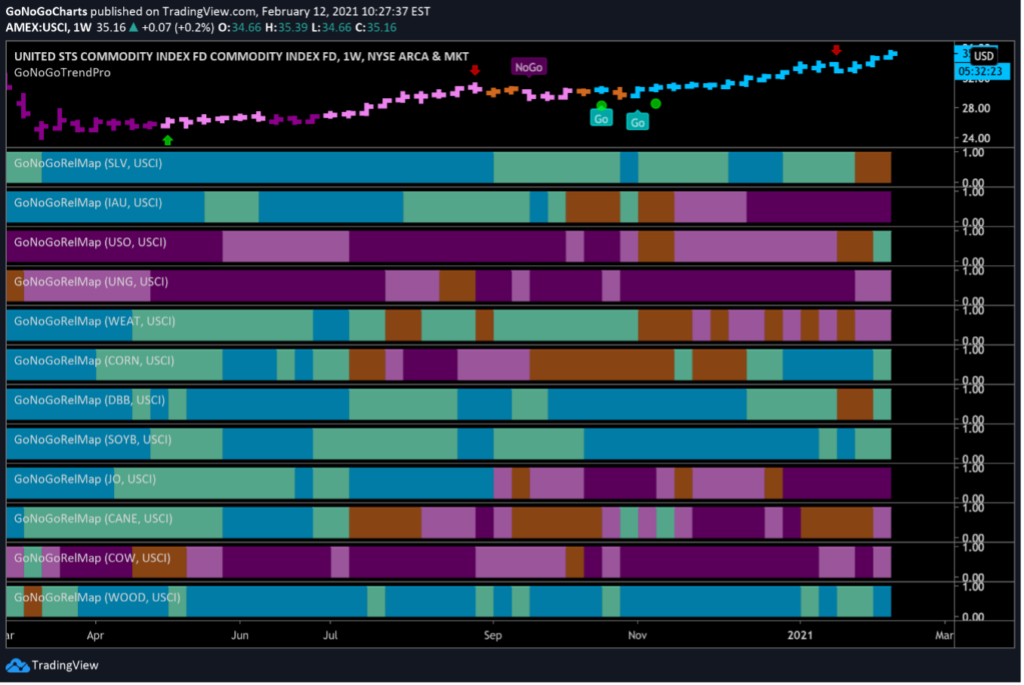
GoNoGo Charts – Allocating to Commodities


The GoNoGo RelMap® below shows the GoNoGo Trend applied to the relative strength ratio of various commodities against the $USCI commodity index as a base. This is a weekly chart, and we can start here to see the major trends. Never forget that when in doubt, zoom out! We can see that corn (panel 6), soybeans (panel 8) and lumber (last panel) are in long term “Go” trends. We can also see that in the top panel, silver, while painting an amber band at the end of the week has been an outperformer relative to the Commodities Index since March of last year.
SOY SET TO SOAR
The GoNoGo Daily chart below shows that $SOYB has been in a very strong trend since the summer of 2020. We have seen price move in waves as it always does in a trend, surging on heavy momentum and depicted by bright blue “Go” bars, with areas of correction/consolidation as the GoNoGo Oscillator falls to the zero line while the GoNoGo Trend paints weakness with aqua “Go” bars. After another correction against the trend over the last several weeks, the GoNoGo Oscillator has once again fallen to zero and we will look to see if it can find support here as it should if the trend is to continue.
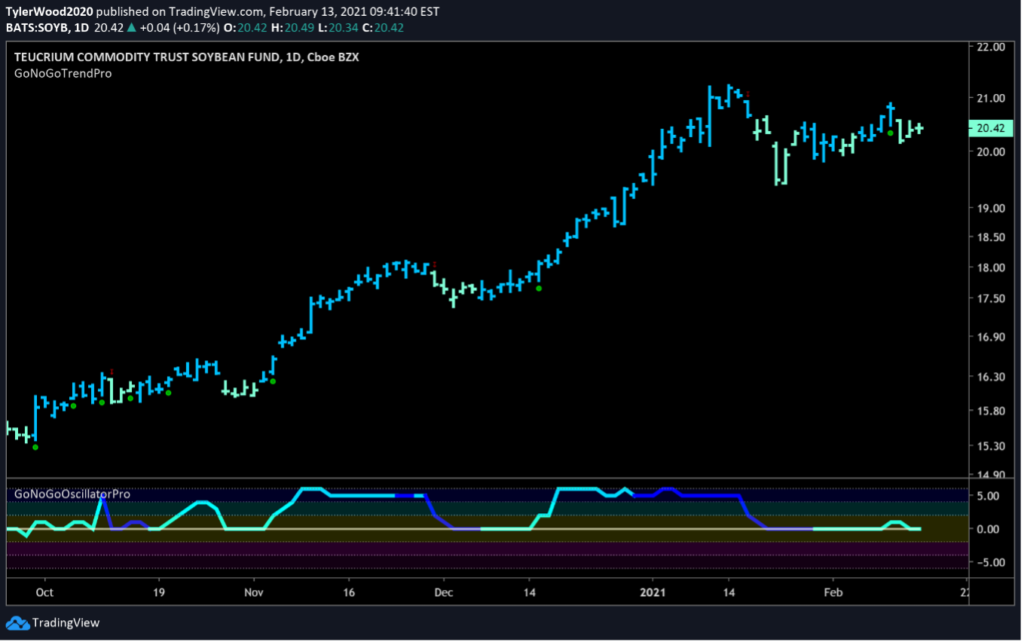
As price movements have narrowed, volume has lessened as depicted by the lighter green oscillator line. When GoNoGo Oscillator drops to the zero line and remains at zero, it tells us that momentum is neither overbought nor oversold. In other words, enthusiastic buying and selling and volatile price swings have diminished.
This contracted volatility often leads to a decisive move in either direction once the stalemate is broken. If GoNoGo Oscillator breaks out of the squeeze into positive territory, we will see a new low-risk trend continuation icon under the price bar and likely a surge in price.
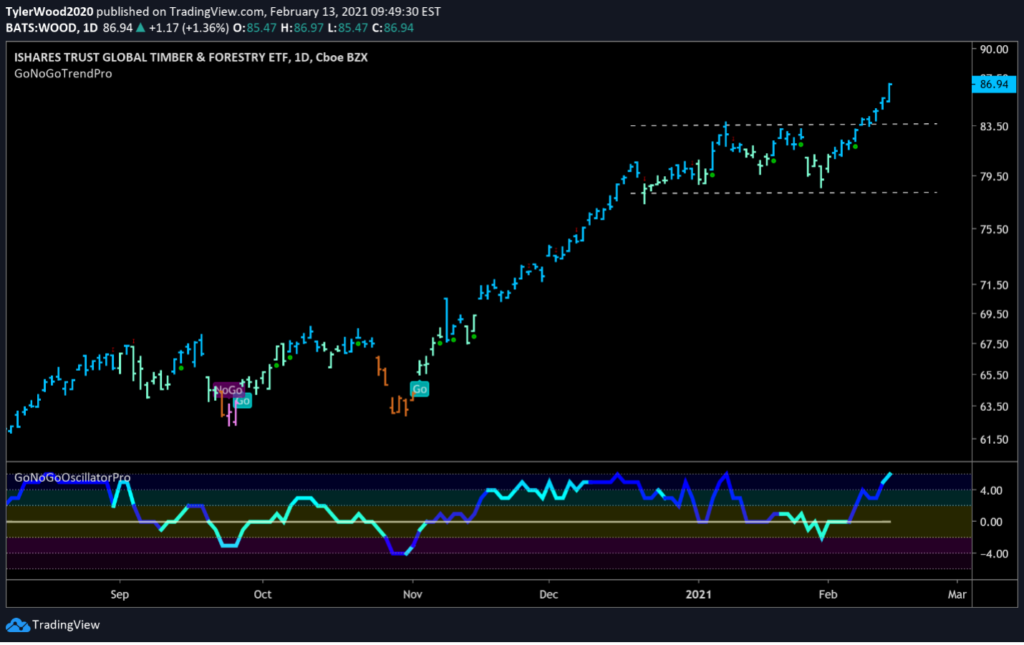
LUMBER LIFTS OFF
$WOOD, the lumber ETF has also seen impressive gains over the past several months. However, the lumber ETF was facing some significant resistance. In this case, the consolidation took the form of a sideways channel. Price ran up against the upper bound of the channel twice before breaking out to the upside this week. At the third test, price approached the top of the channel just as the GoNoGo Oscillator rallied off the zero line on heavy volume (shown by the dark blue oscillator).