Flight Path – “Tough Time for Equities as Technology Pulls Stocks Lower”

“Tough Time for Equities as Technology Pulls Stocks Lower”
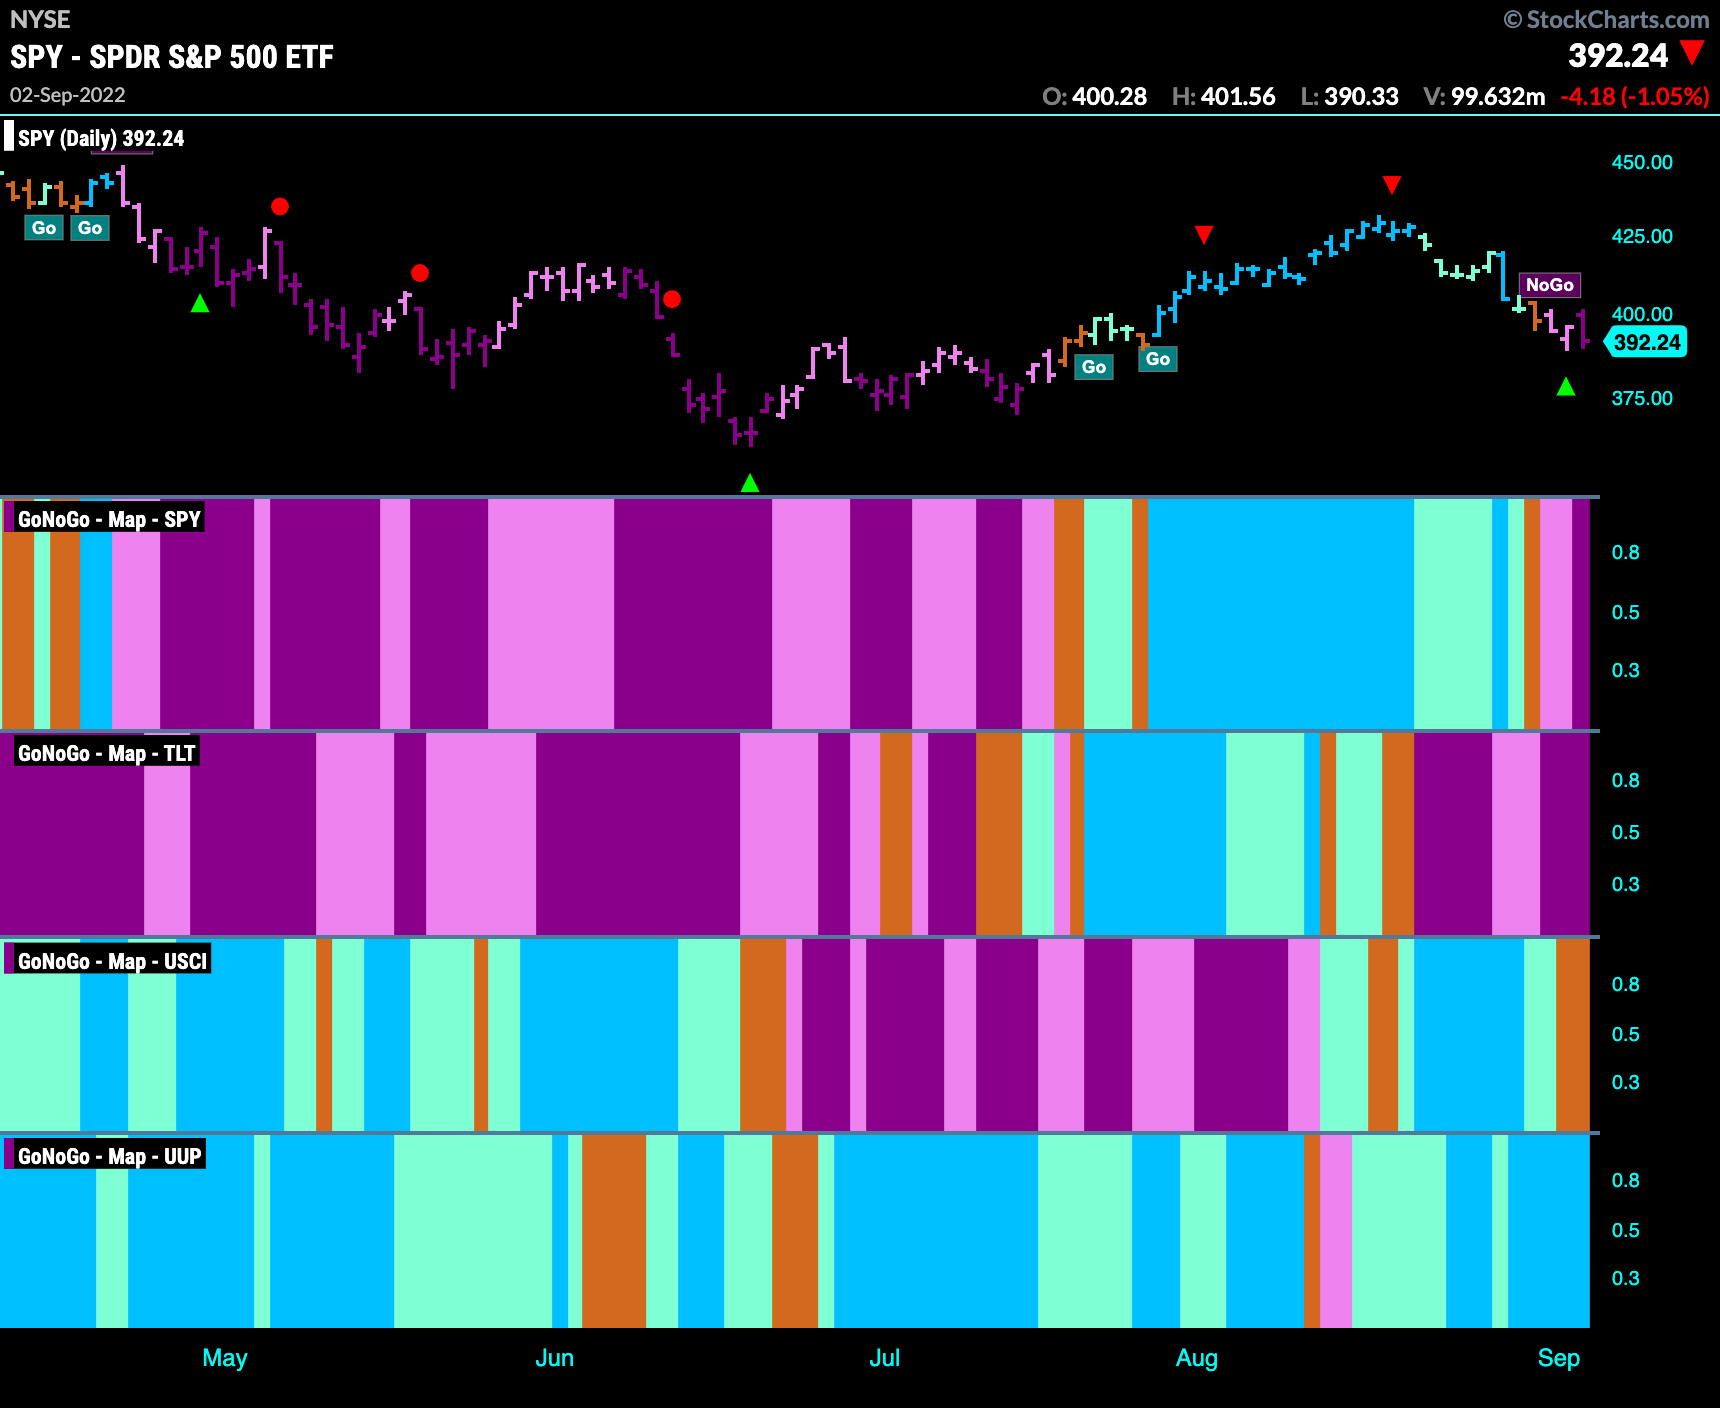
Good morning and welcome to this week’s Flight Path. Let’s take a look at the GoNoGo Asset map below. Equities fell out of the “Go” trend this week and after an amber “Go Fish” bar fell into a “NoGo” trend, ending the week with a strong purple bar. Treasury bond prices, in the second panel continued to be embroiled in a “NoGo” and commodities faltered a little painting an amber “Go Fish” bar. The dollar was the lone holdout in a “Go” trend this week.

S&P 500 Falls into NoGo
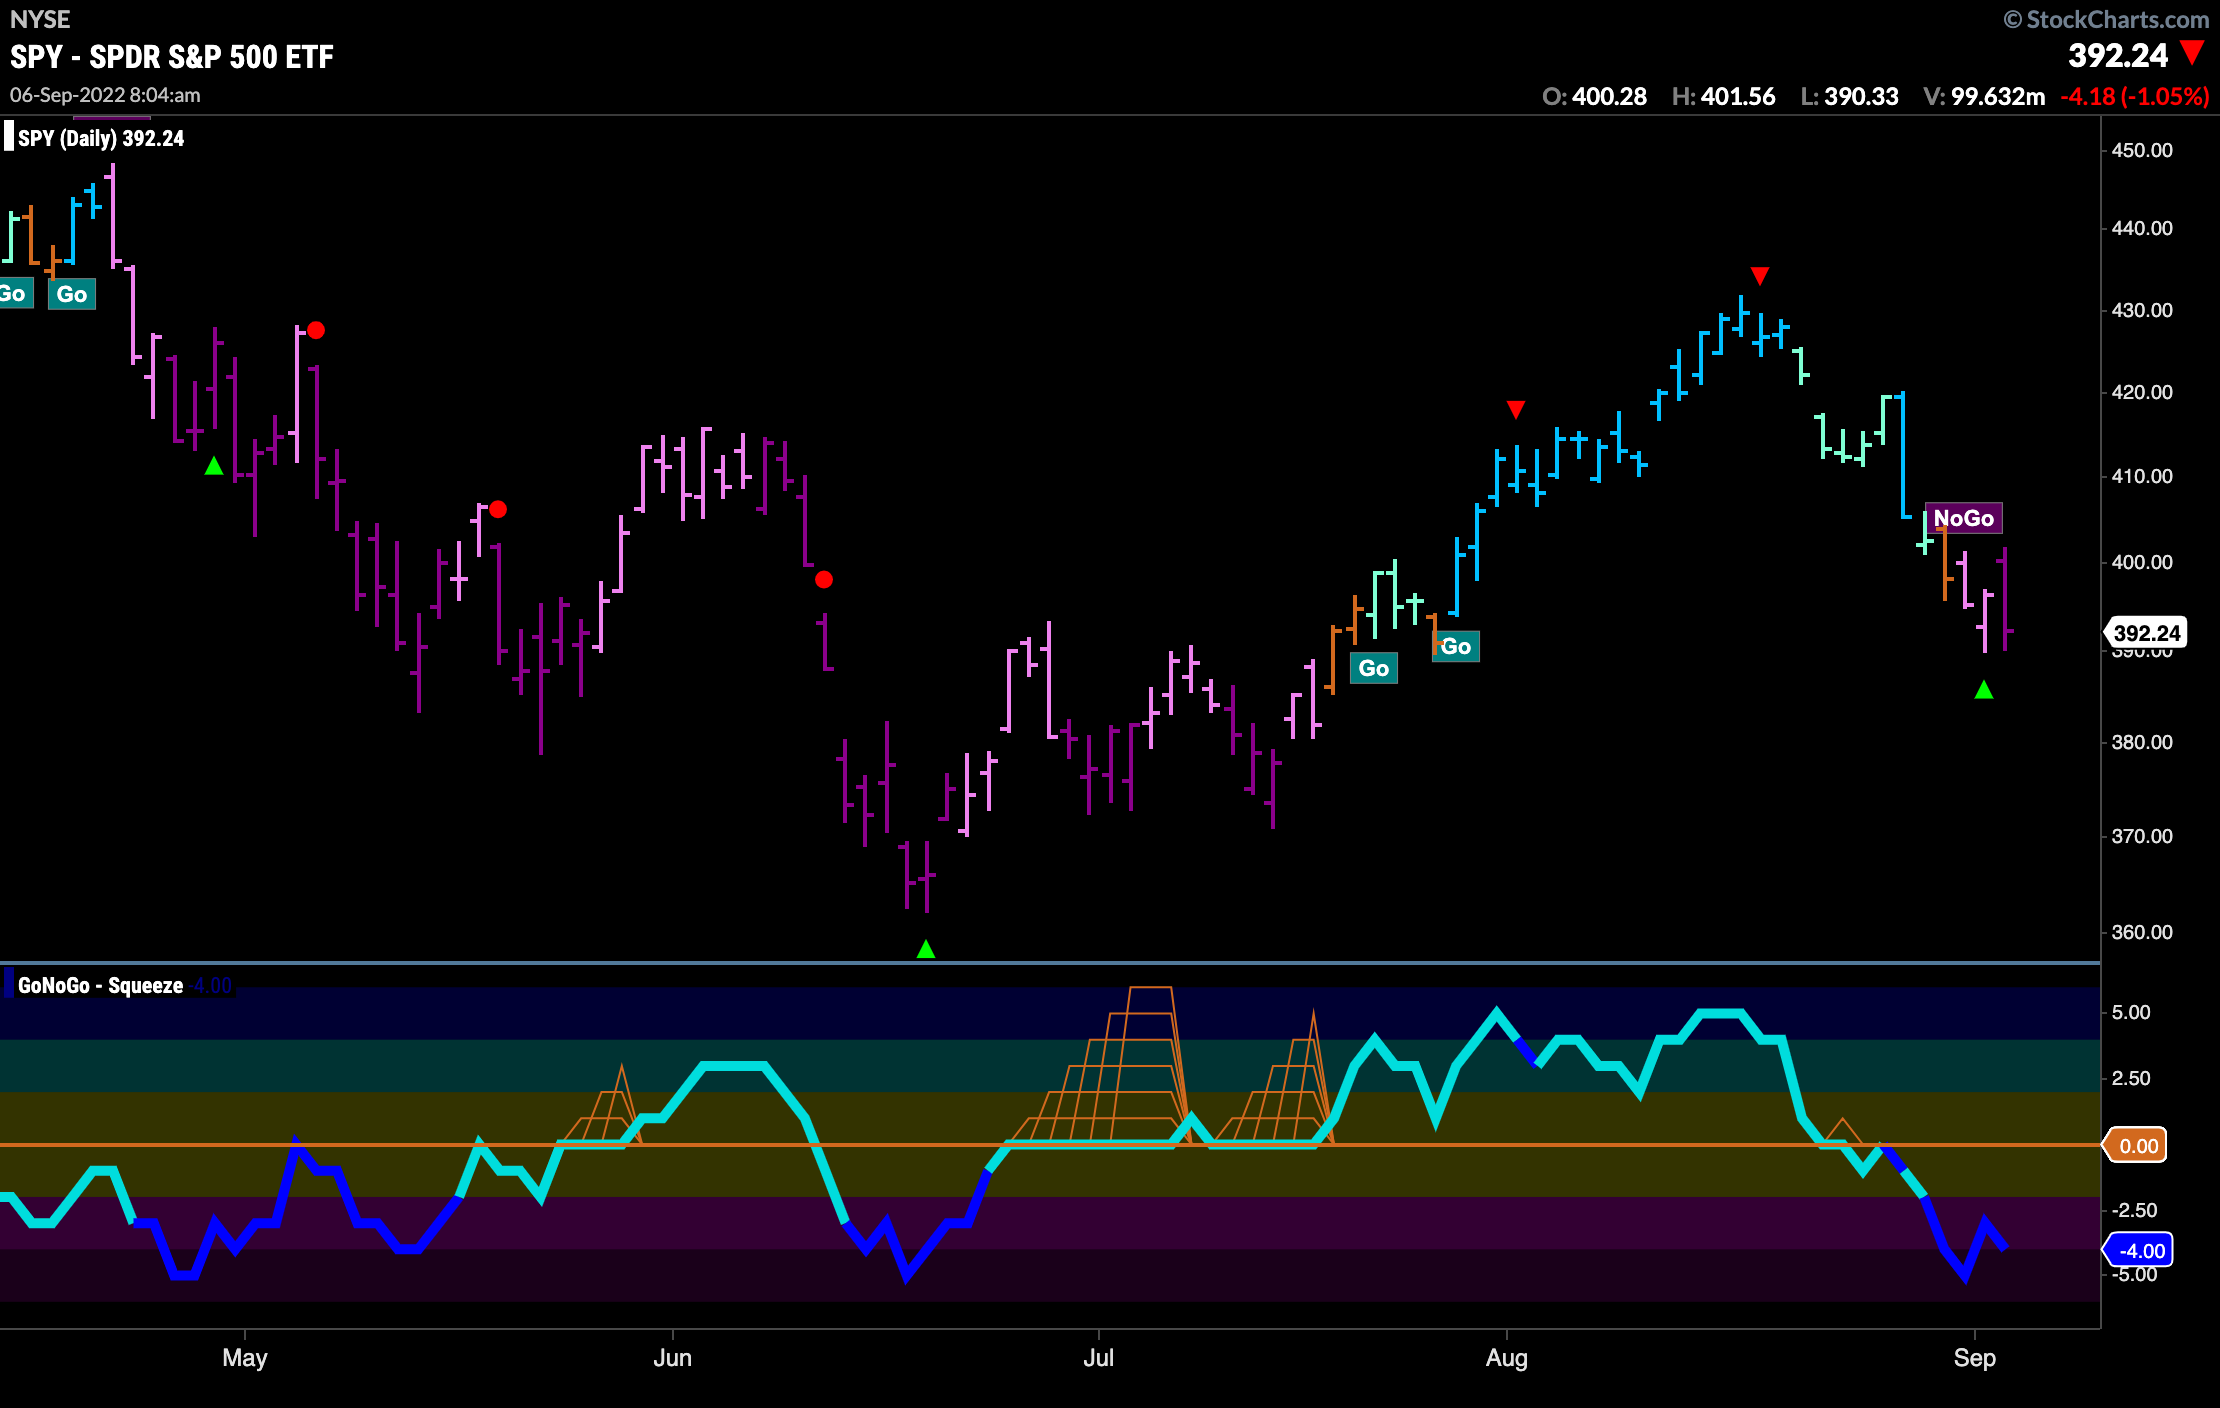
More selling in U.S. equities this week. An attempt to rally on Friday saw the bears turn around the day and the close was lower causing GoNoGo Trend to paint a strong “NoGo” purple bar. Last week we noted how GoNoGo Oscillator had failed to hold the zero line and this week saw the oscillator fall further into negative territory on heavy volume.
“Go” Trend Continues in Rates
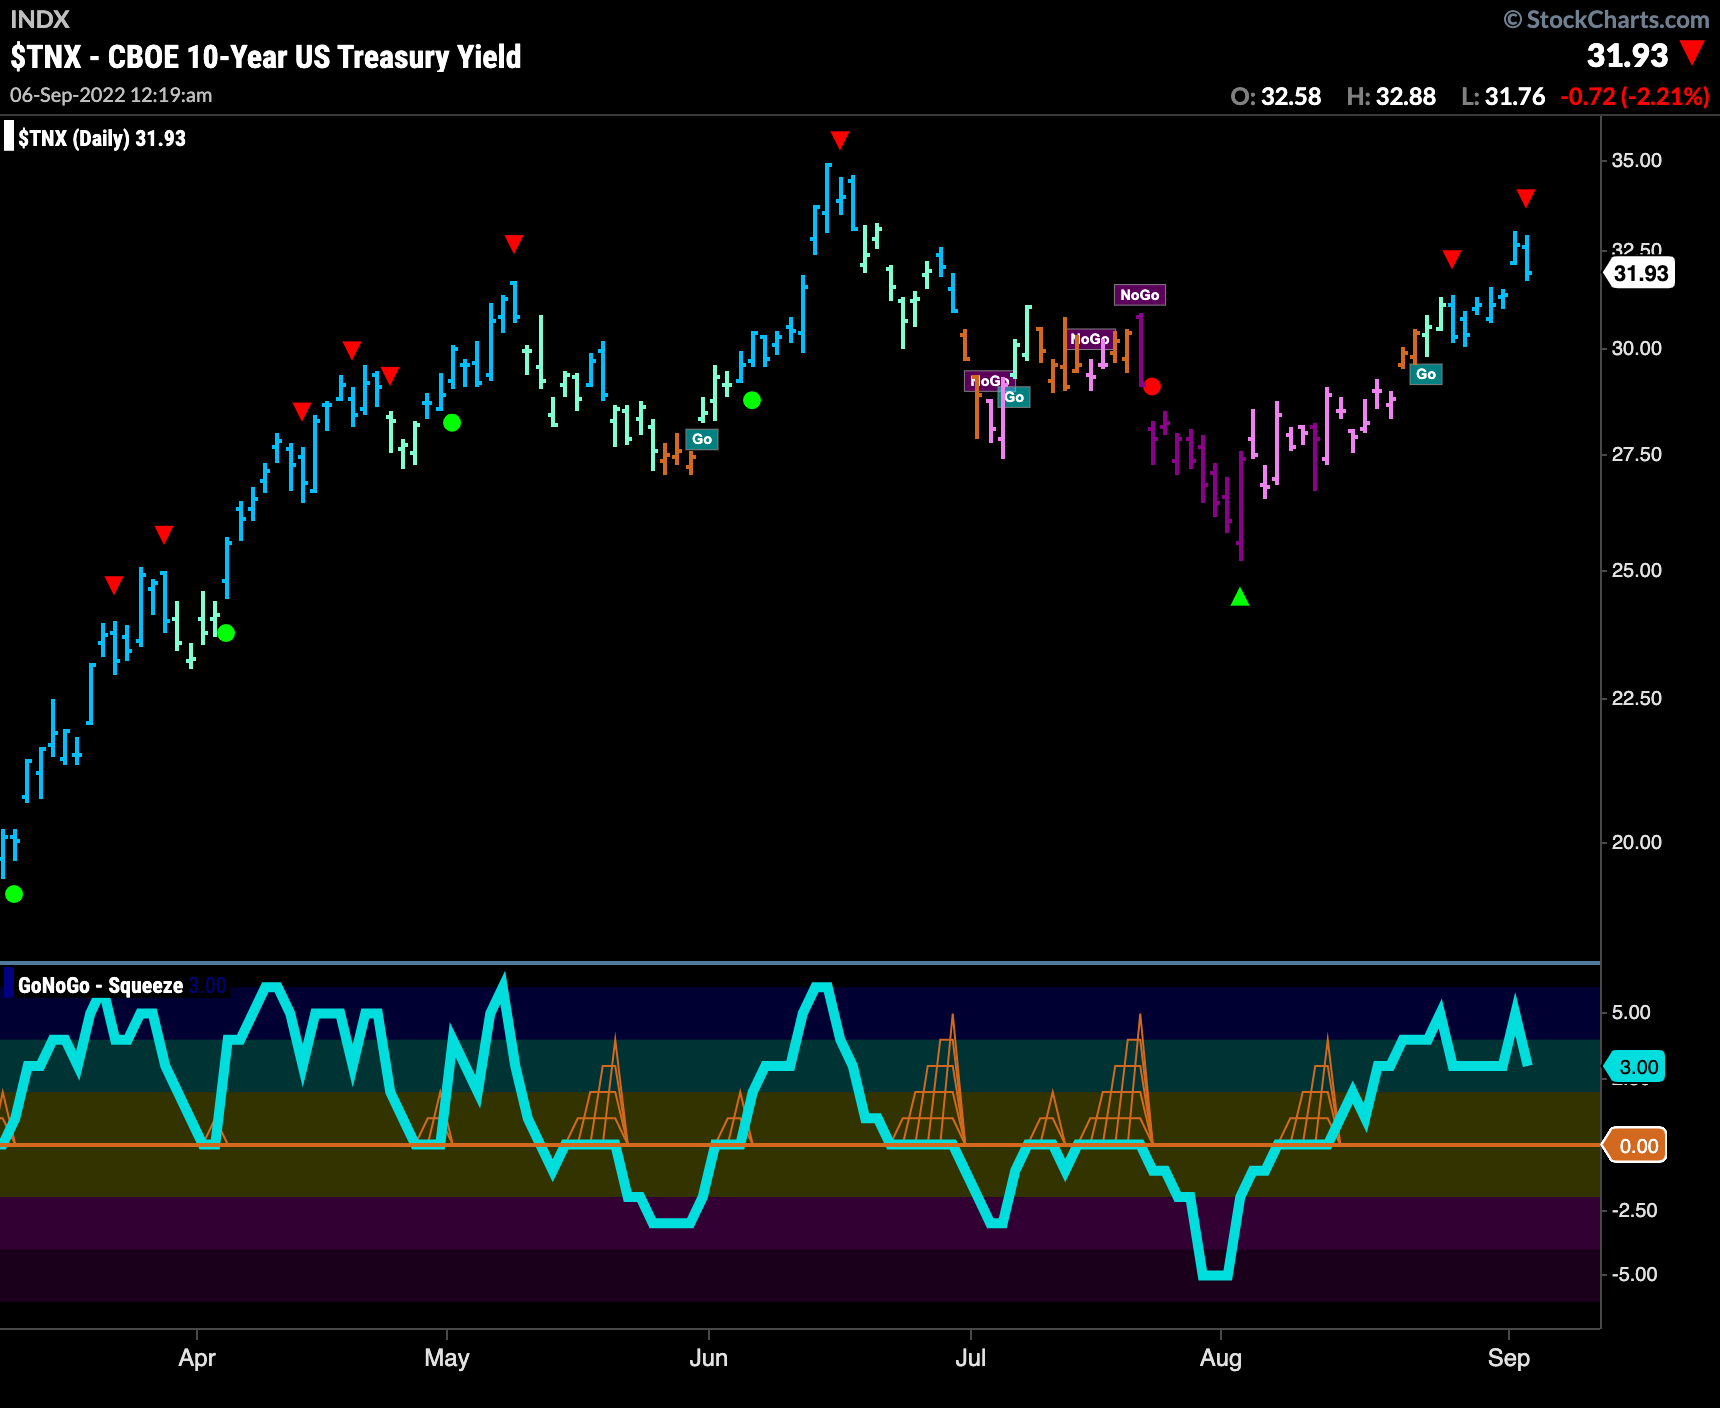
As the equity market struggled rates rose most of this week. GoNoGo Trend continues to paint a string of blue “Go” bars as price climbs to an intermediate term high. As GoNoGo Oscillator comes off overbought we can expect a slight struggle in the short term for further gains but long term the “Go” trend is in place and looking strong. The next momentum surge should see price test the prior highs from late June.
Dollar Makes New High
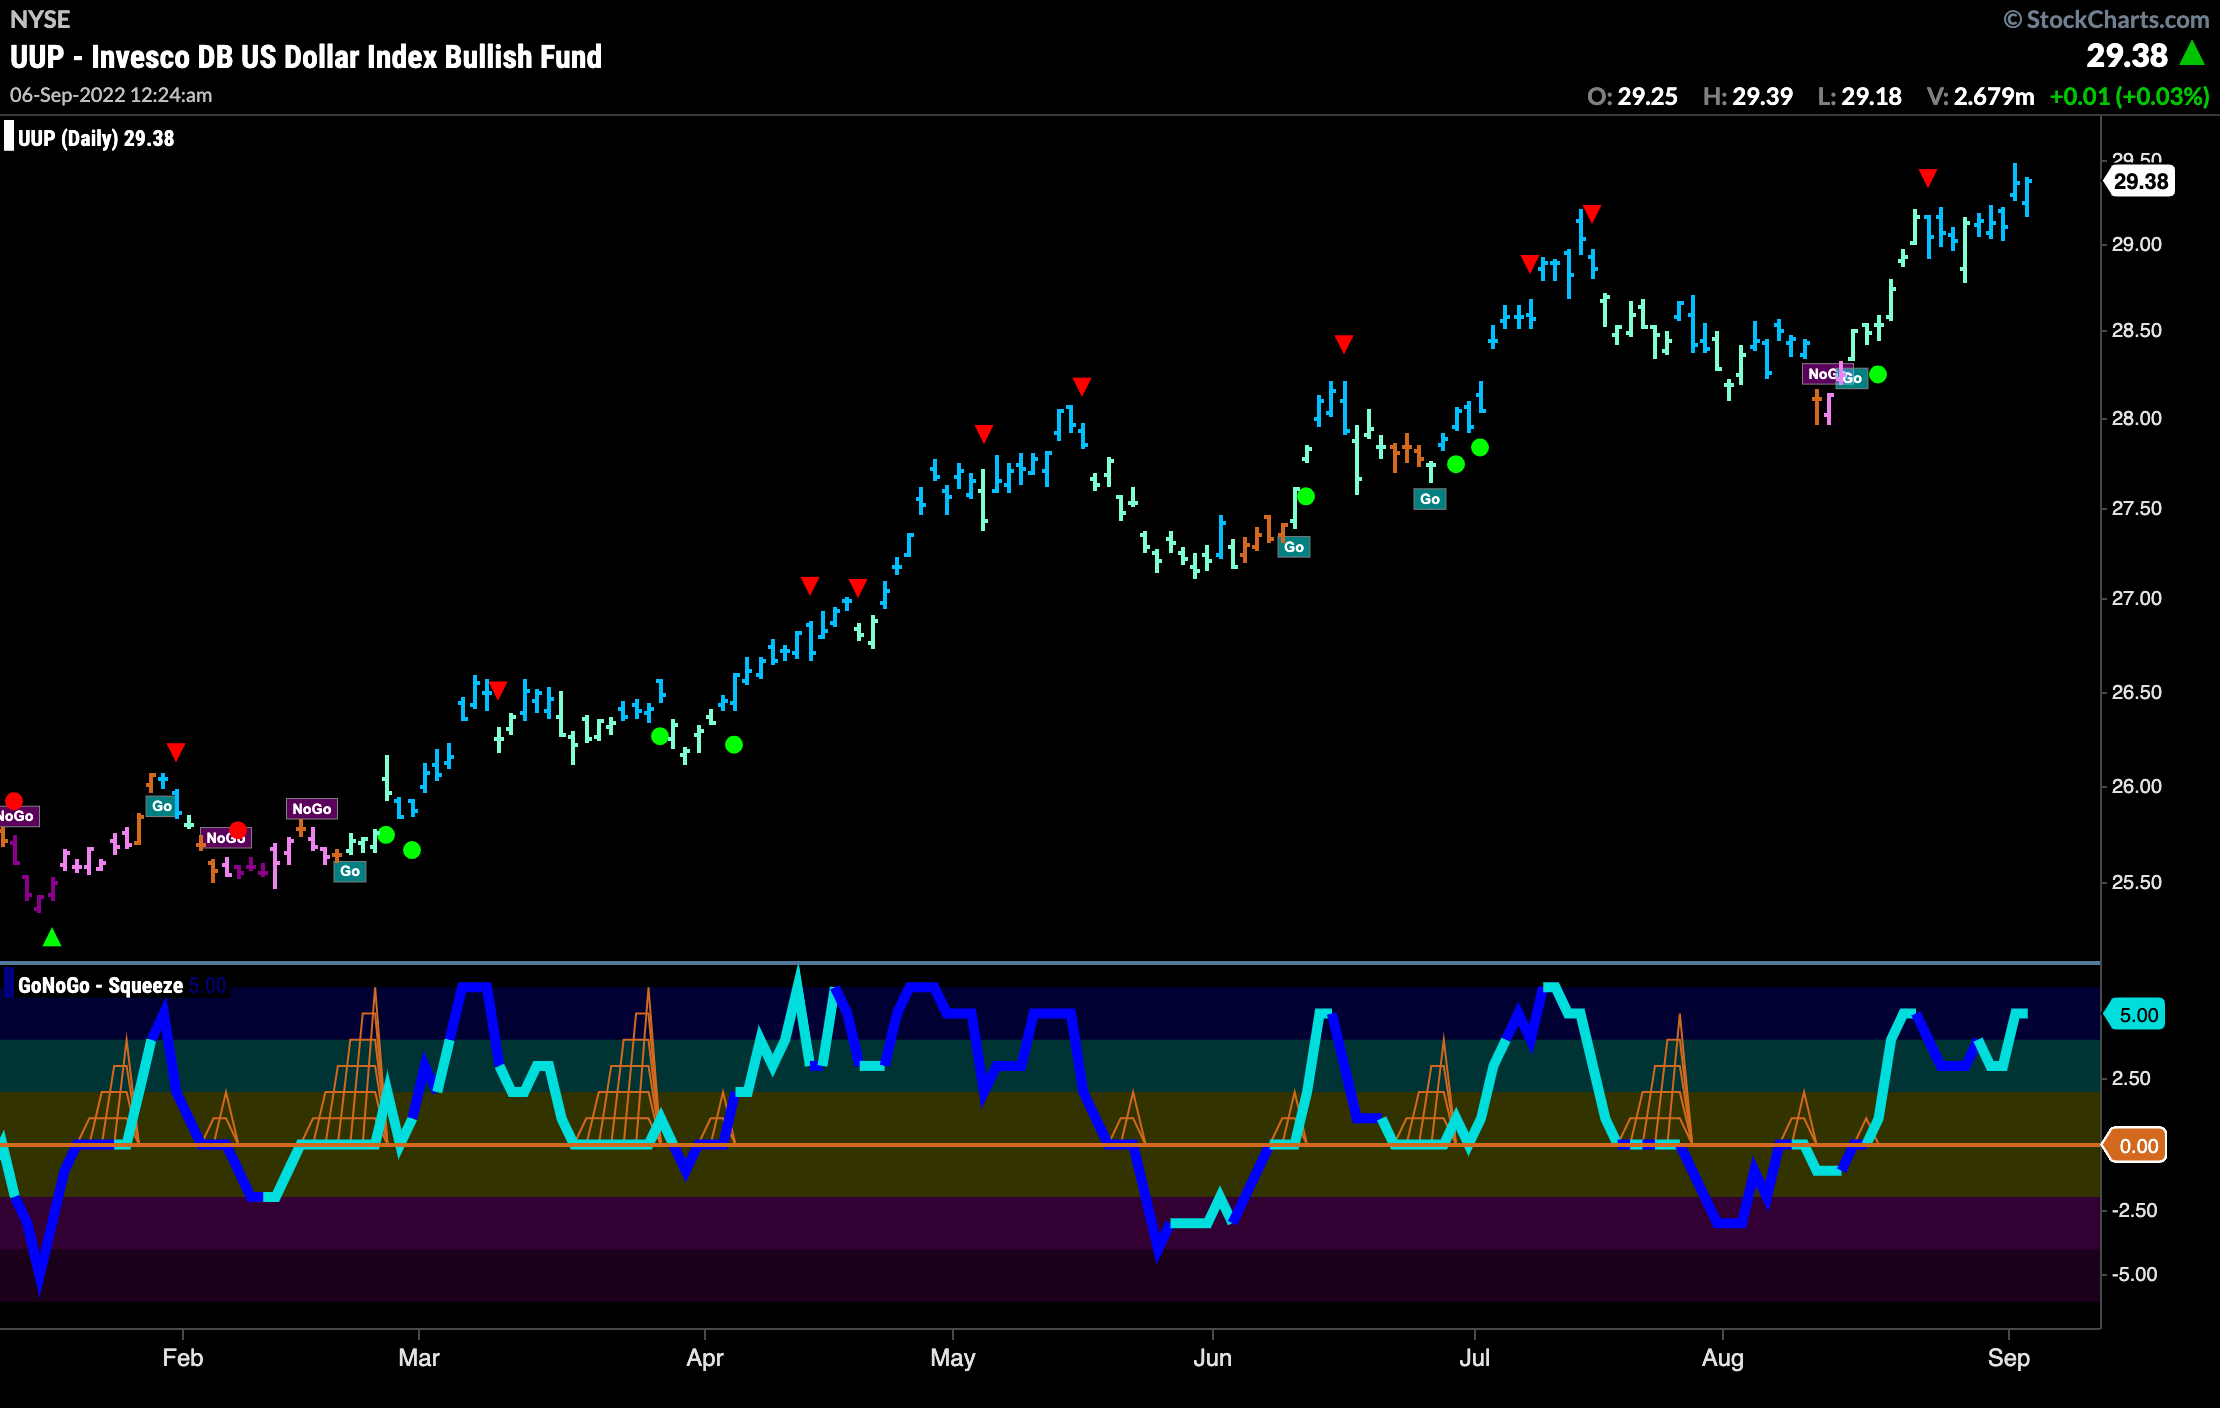
The dollar made a new high this week as GoNoGo Trend shows strength with bright blue “Go” bars. This new high propelled price out of a small congestion area at levels that were acting as resistance from prior high in July. GoNoGo Oscillator is now overbought on light volume. We will look to see if price can consolidate at these levels.
“NoGo” Strengthens as Price Tests Lows
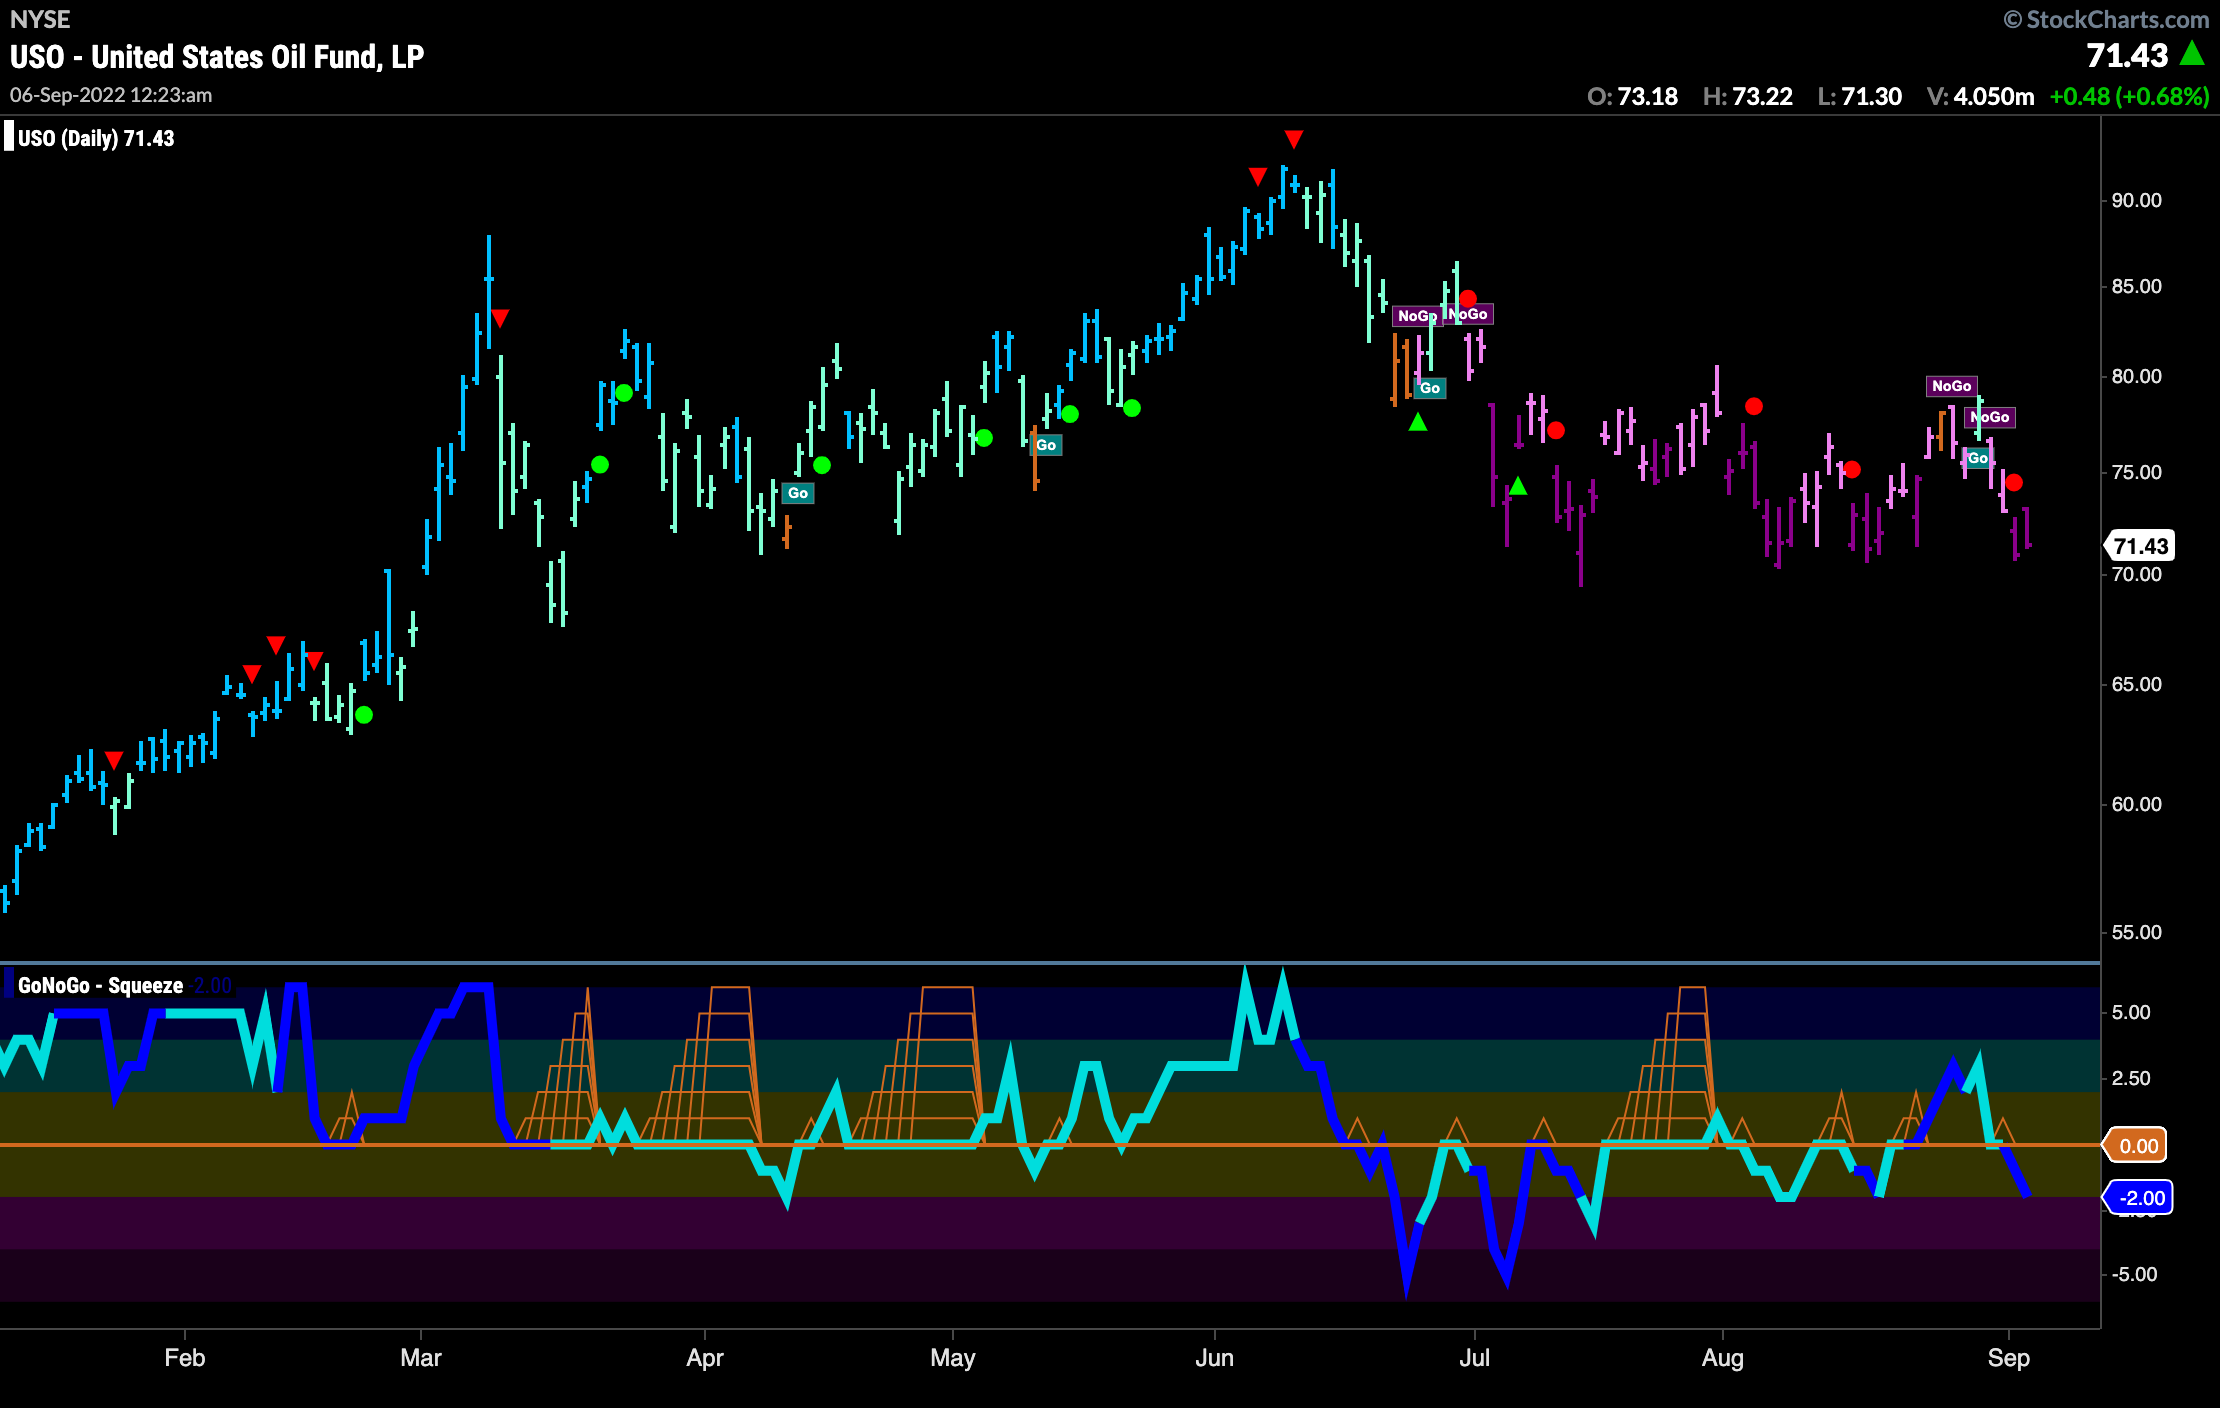
Below is the daily GoNoGo Chart of $USO. The “NoGo” trend has strengthened painting strong purple bars. This is confirmed by GoNoGo Oscillator which after a brief foray into positive territory has fallen back into negative territory on heavy volume. This has triggered a NoGo Trend Continuation Icon (red circle) to appear above a recent price bar.
Sector RelMap
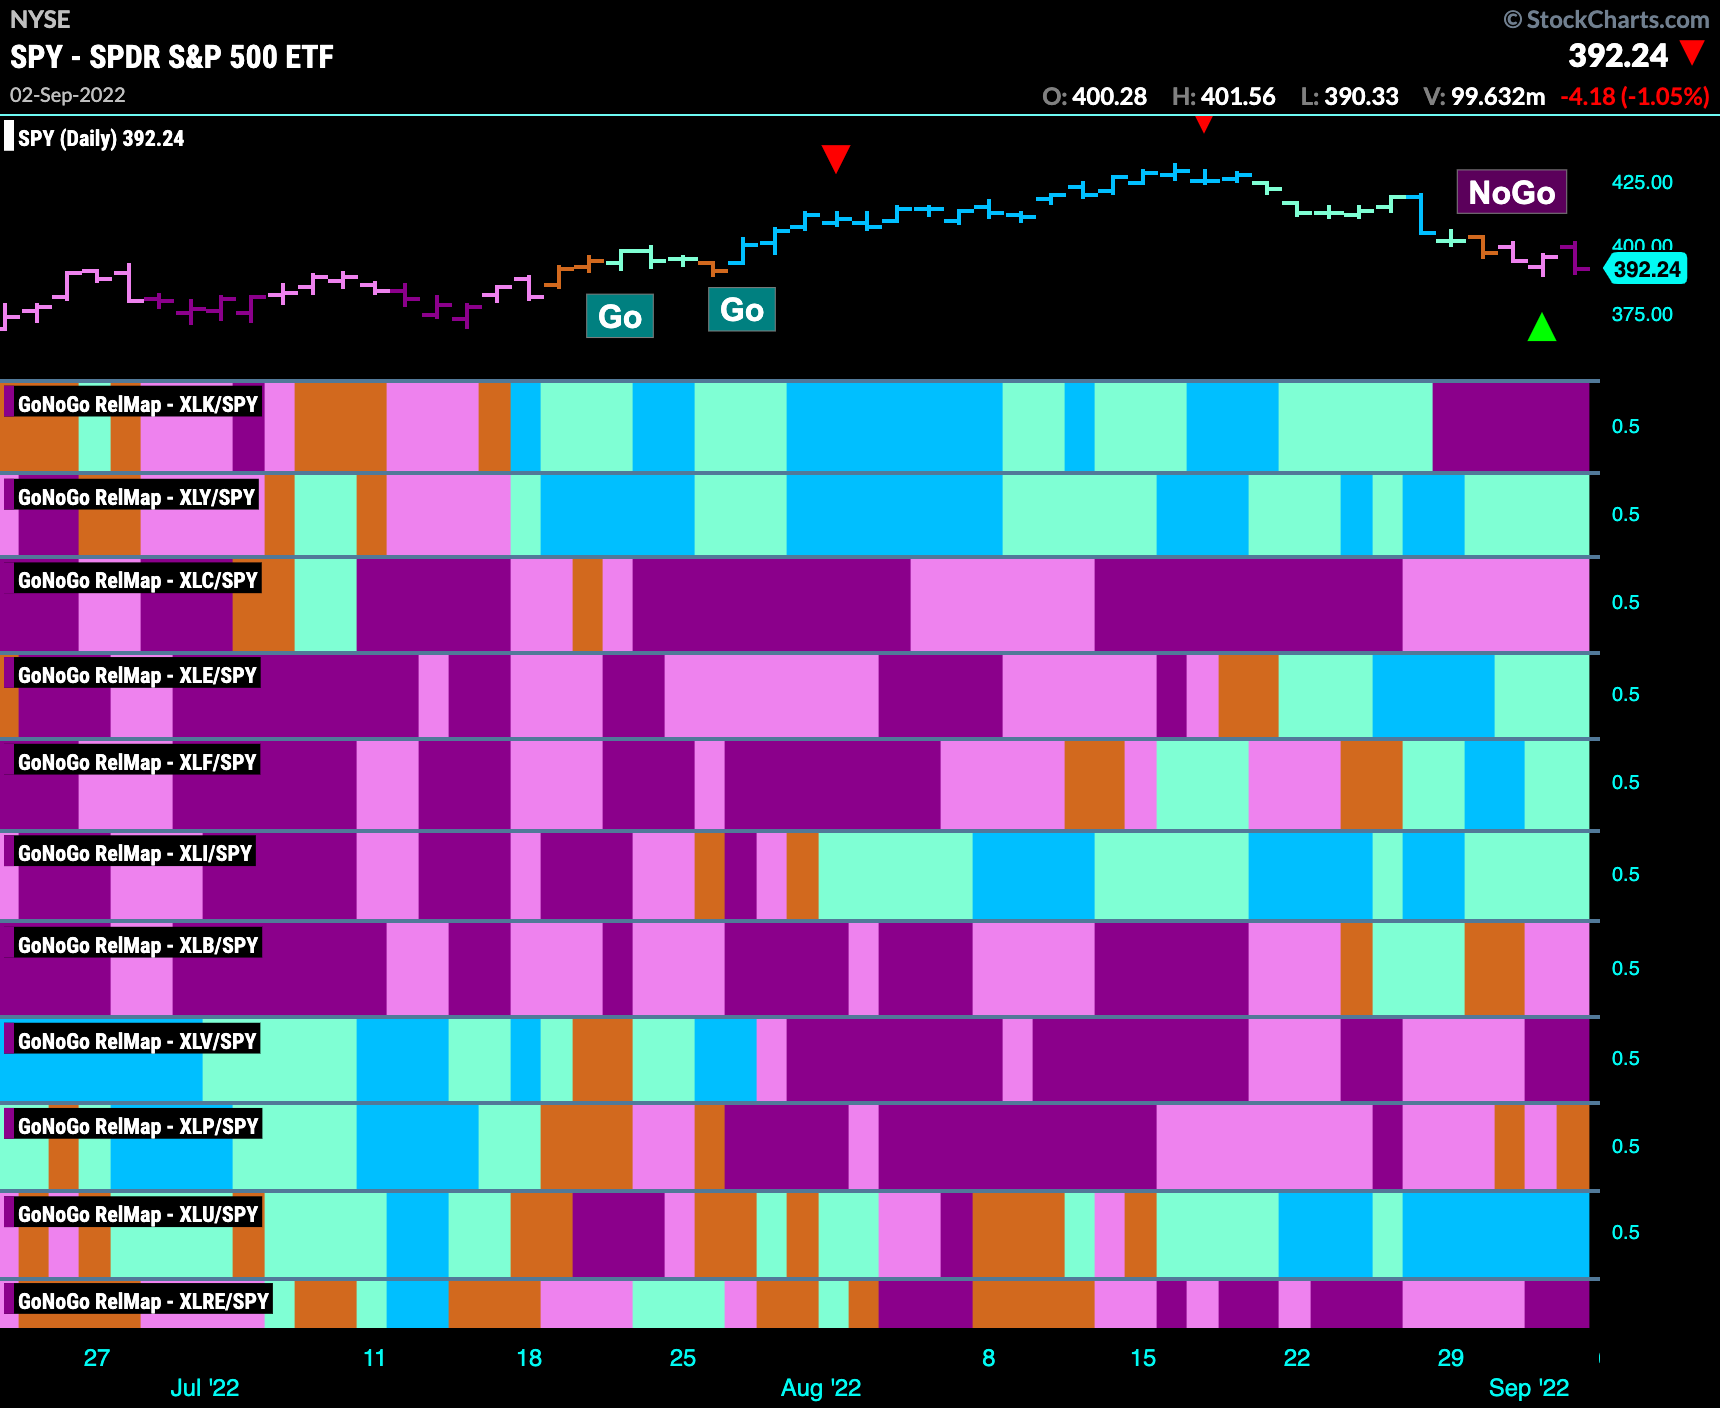
Below is the GoNoGo Sector Relmap. This GoNoGo Relmap applies the GoNoGo Trend to the relative strength ratios of the sectors to the base index. Looking at this map, we can quickly see where the relative outperformance is coming from as well as which sectors are lagging on a relative basis. We can see that this week has been rough for equities. Technology has entered a strong “NoGo” on a relative basis to the base index and paints solid purple “NoGo” bars. We are seeing a rotation back to defensive sectors.
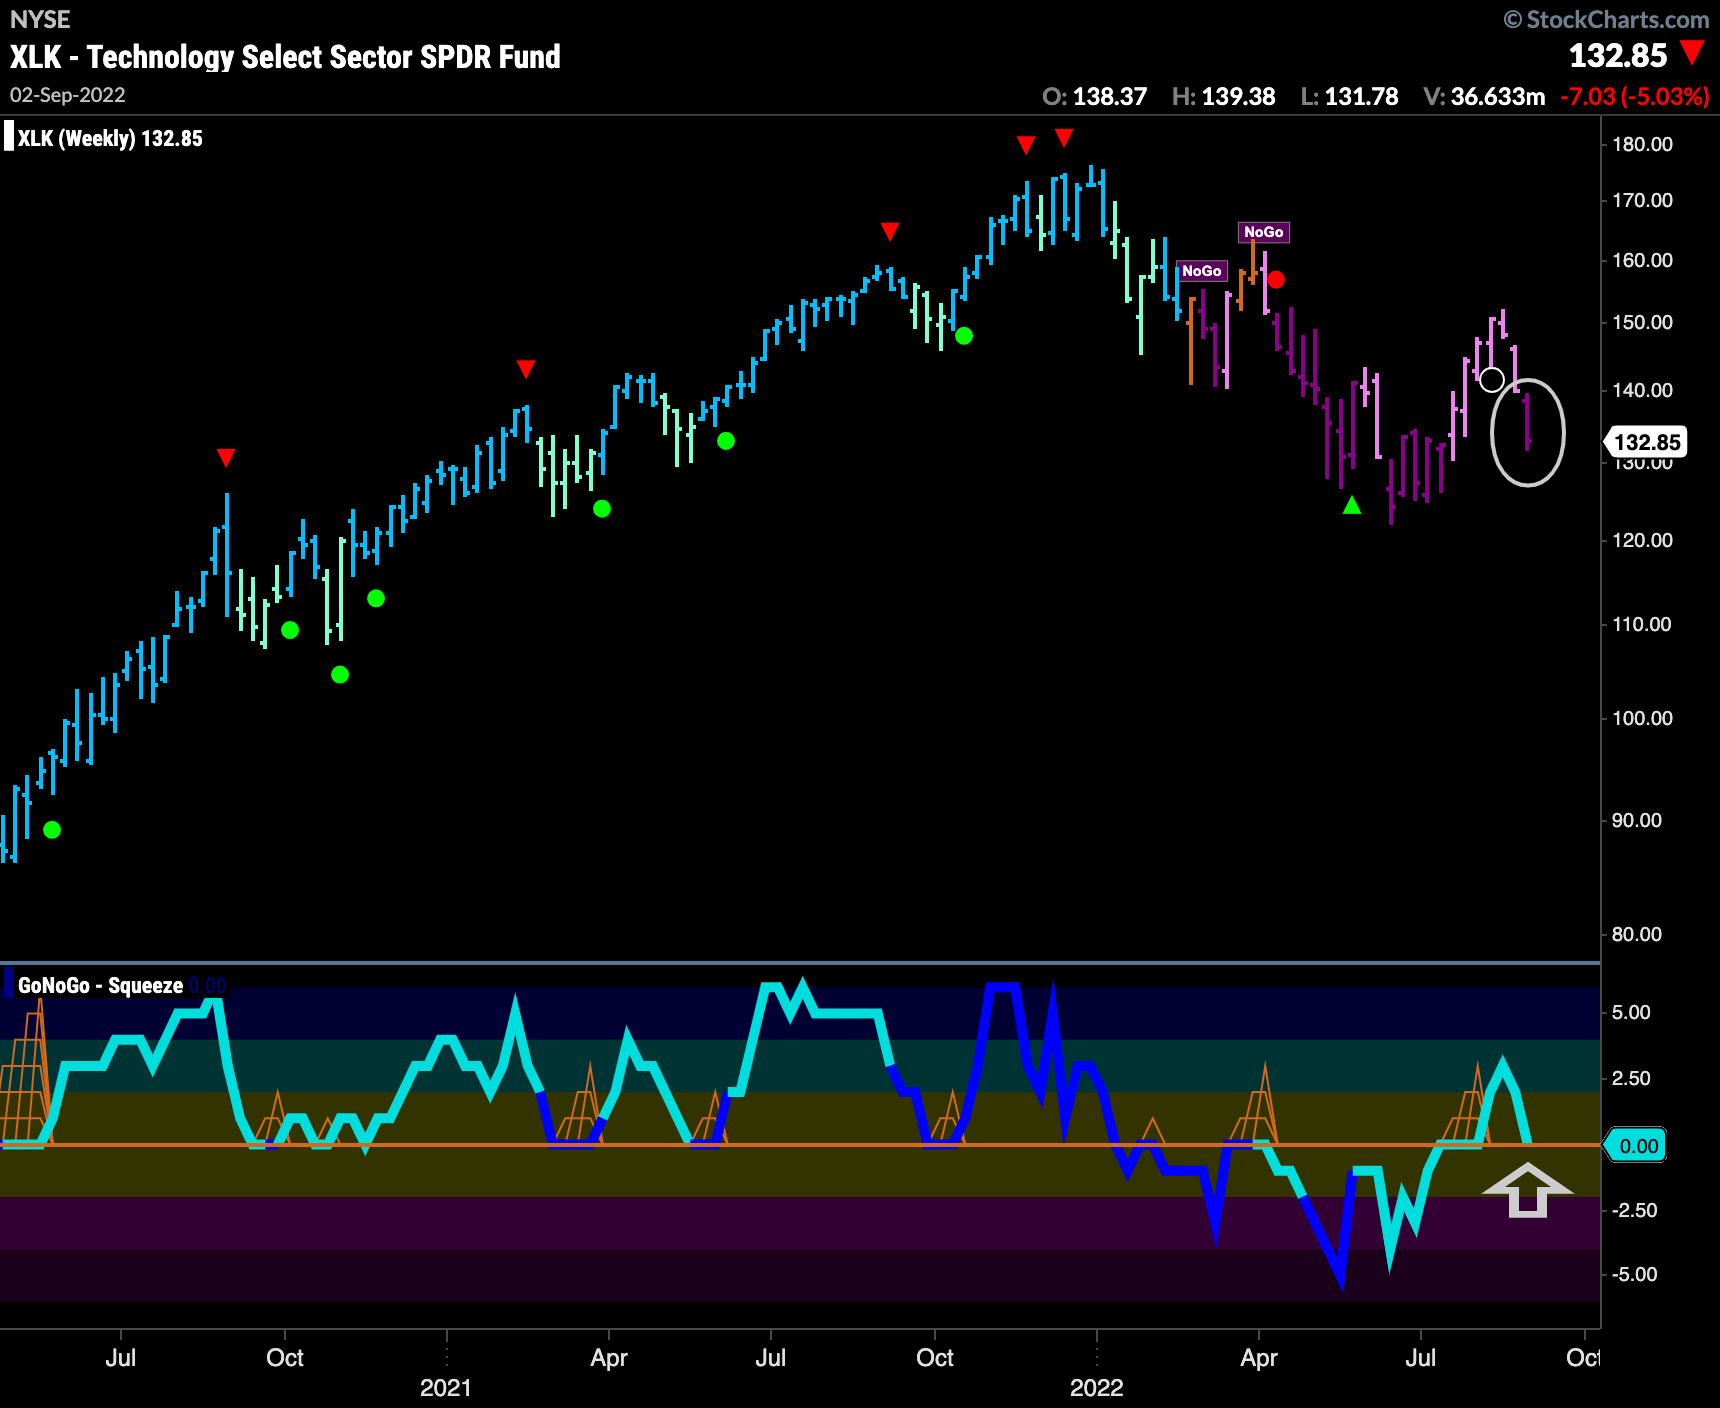
Technology Tumbles
After what looks to have been a relief rally, (several paler pink bars on the weekly chart below), price trend returned to a strong “NoGo” this past week as we see a new purple bar. Importantly, GoNoGo Oscillator has quickly returned to test the zero line from above. We will watch to see if this provides some support or if it falls quickly back into negative territory.
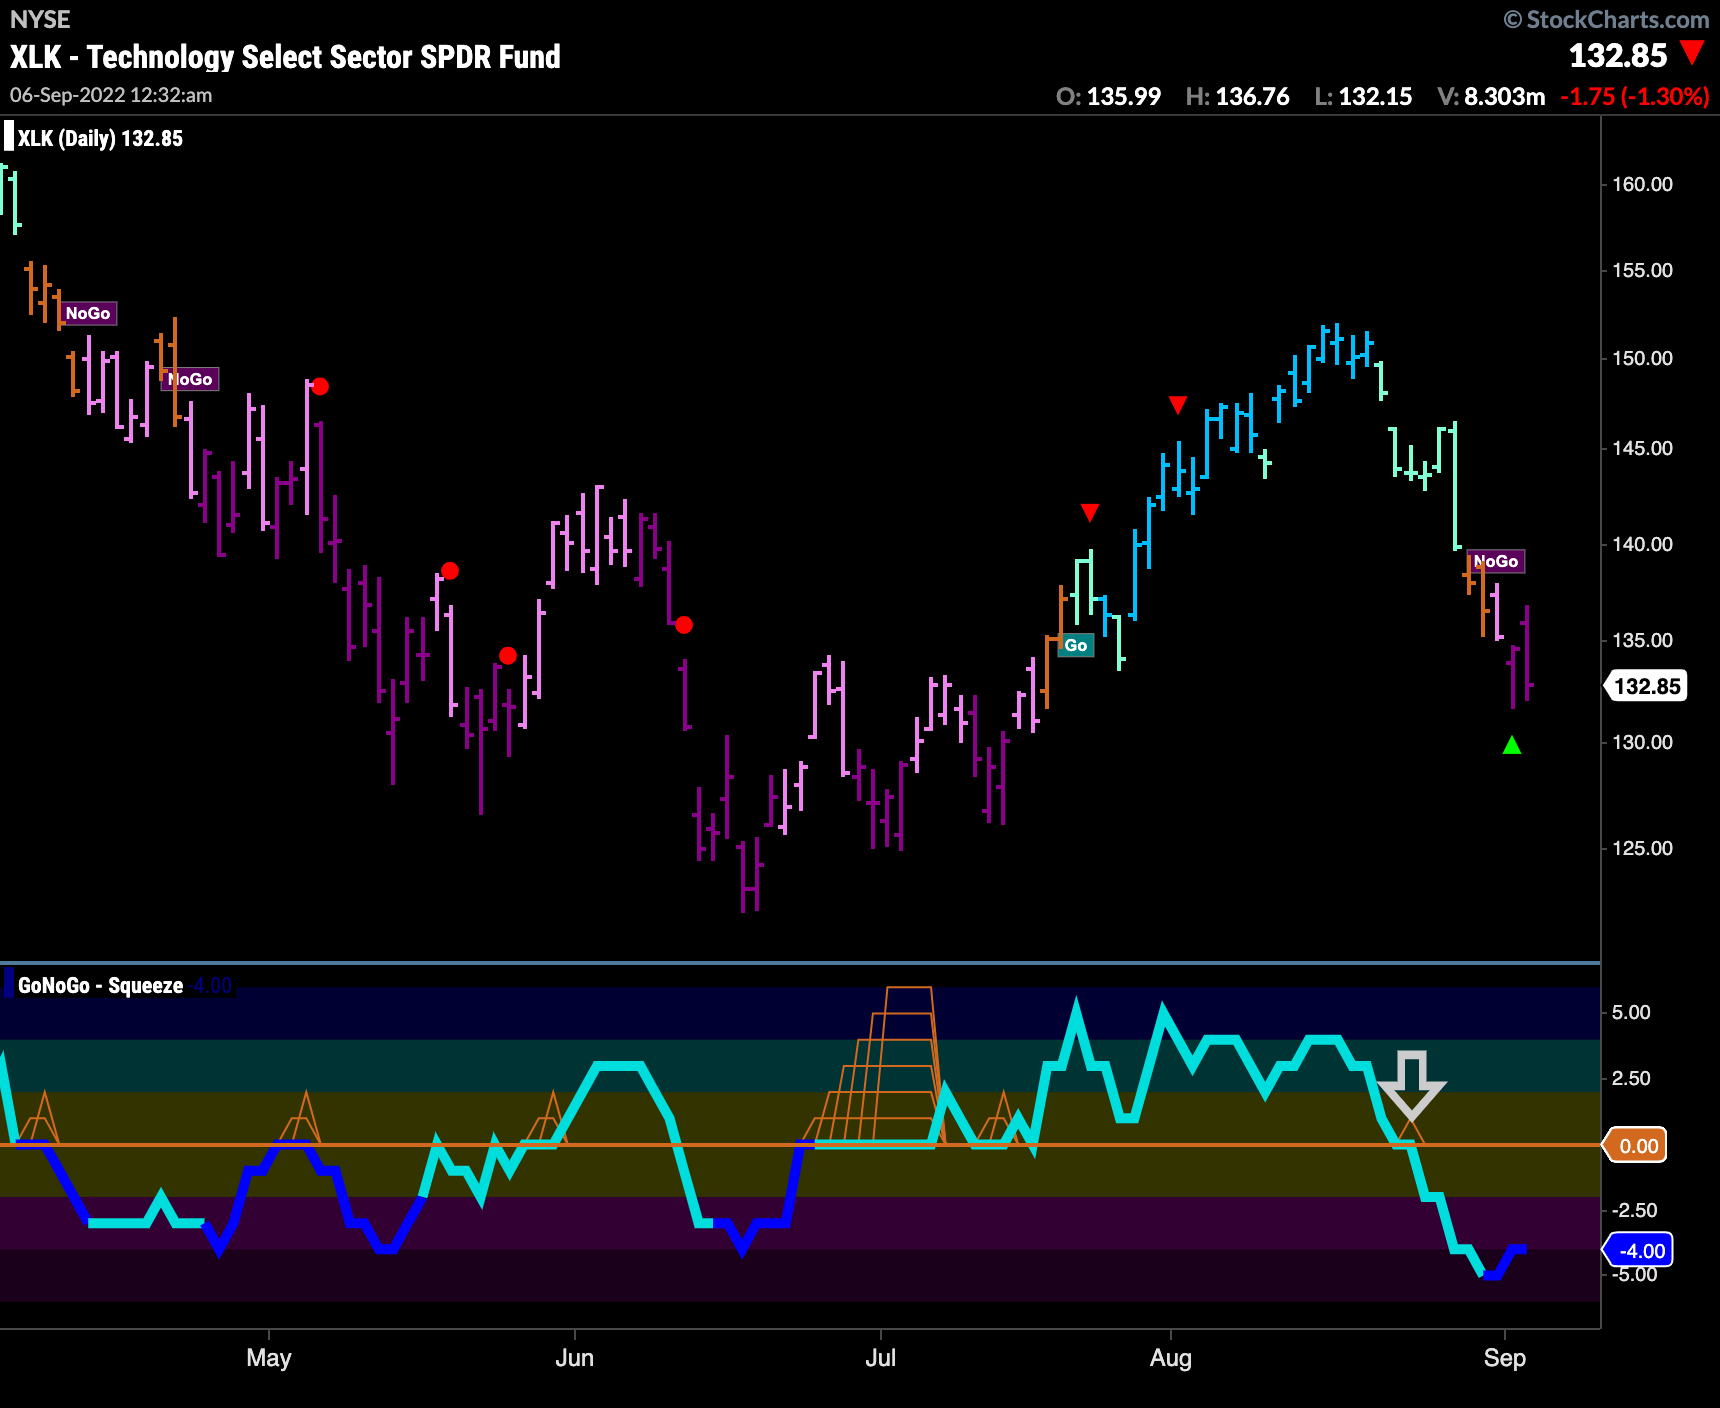
On a daily chart, we can see that GoNoGo Oscillator provided a leading indication that the trend might roll over. August 24th saw the momentum study break back below the zero line telling us that momentum was in contrast to trend. Now, with GoNoGo Trend painting strong purple “NoGo” bars, GoNoGo Oscillator is firmly in negative territory on heavy volume.
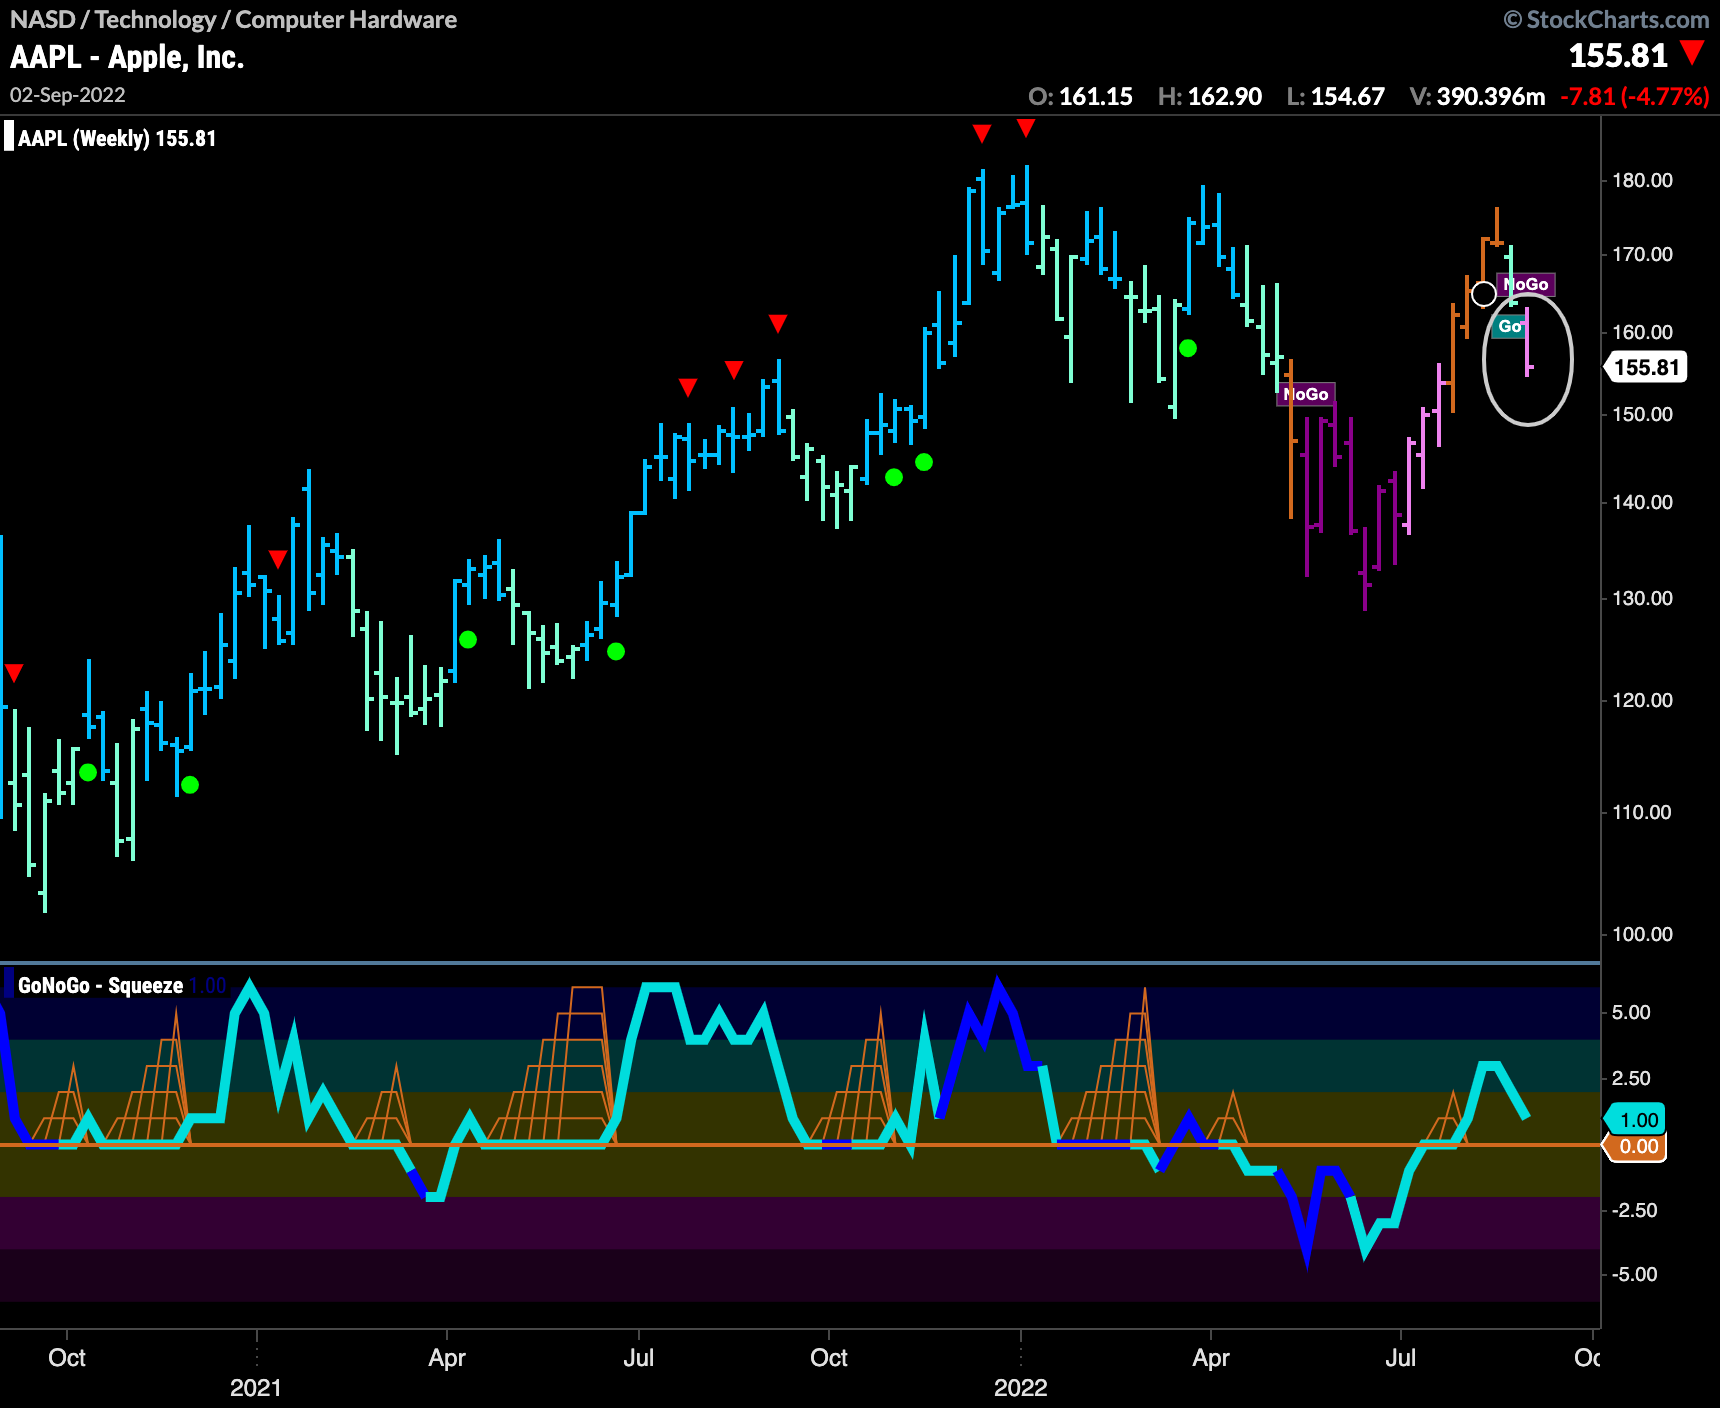
Apple, Inc, Gives in to “NoGo” Trend on Multiple Timeframes
Below is the weekly GoNoGo Chart of Apple, Inc. We can see that while Apple significantly outperformed the domestic U.S. markets over the past several months rallying into a string of amber “Go Fish” bars and even a weak aqua “Go” bar, it has succumbed and fallen back into a “NoGo”. GoNoGo Oscillator, while still positive is fast approaching the zero line where we will look to see if it can find support.
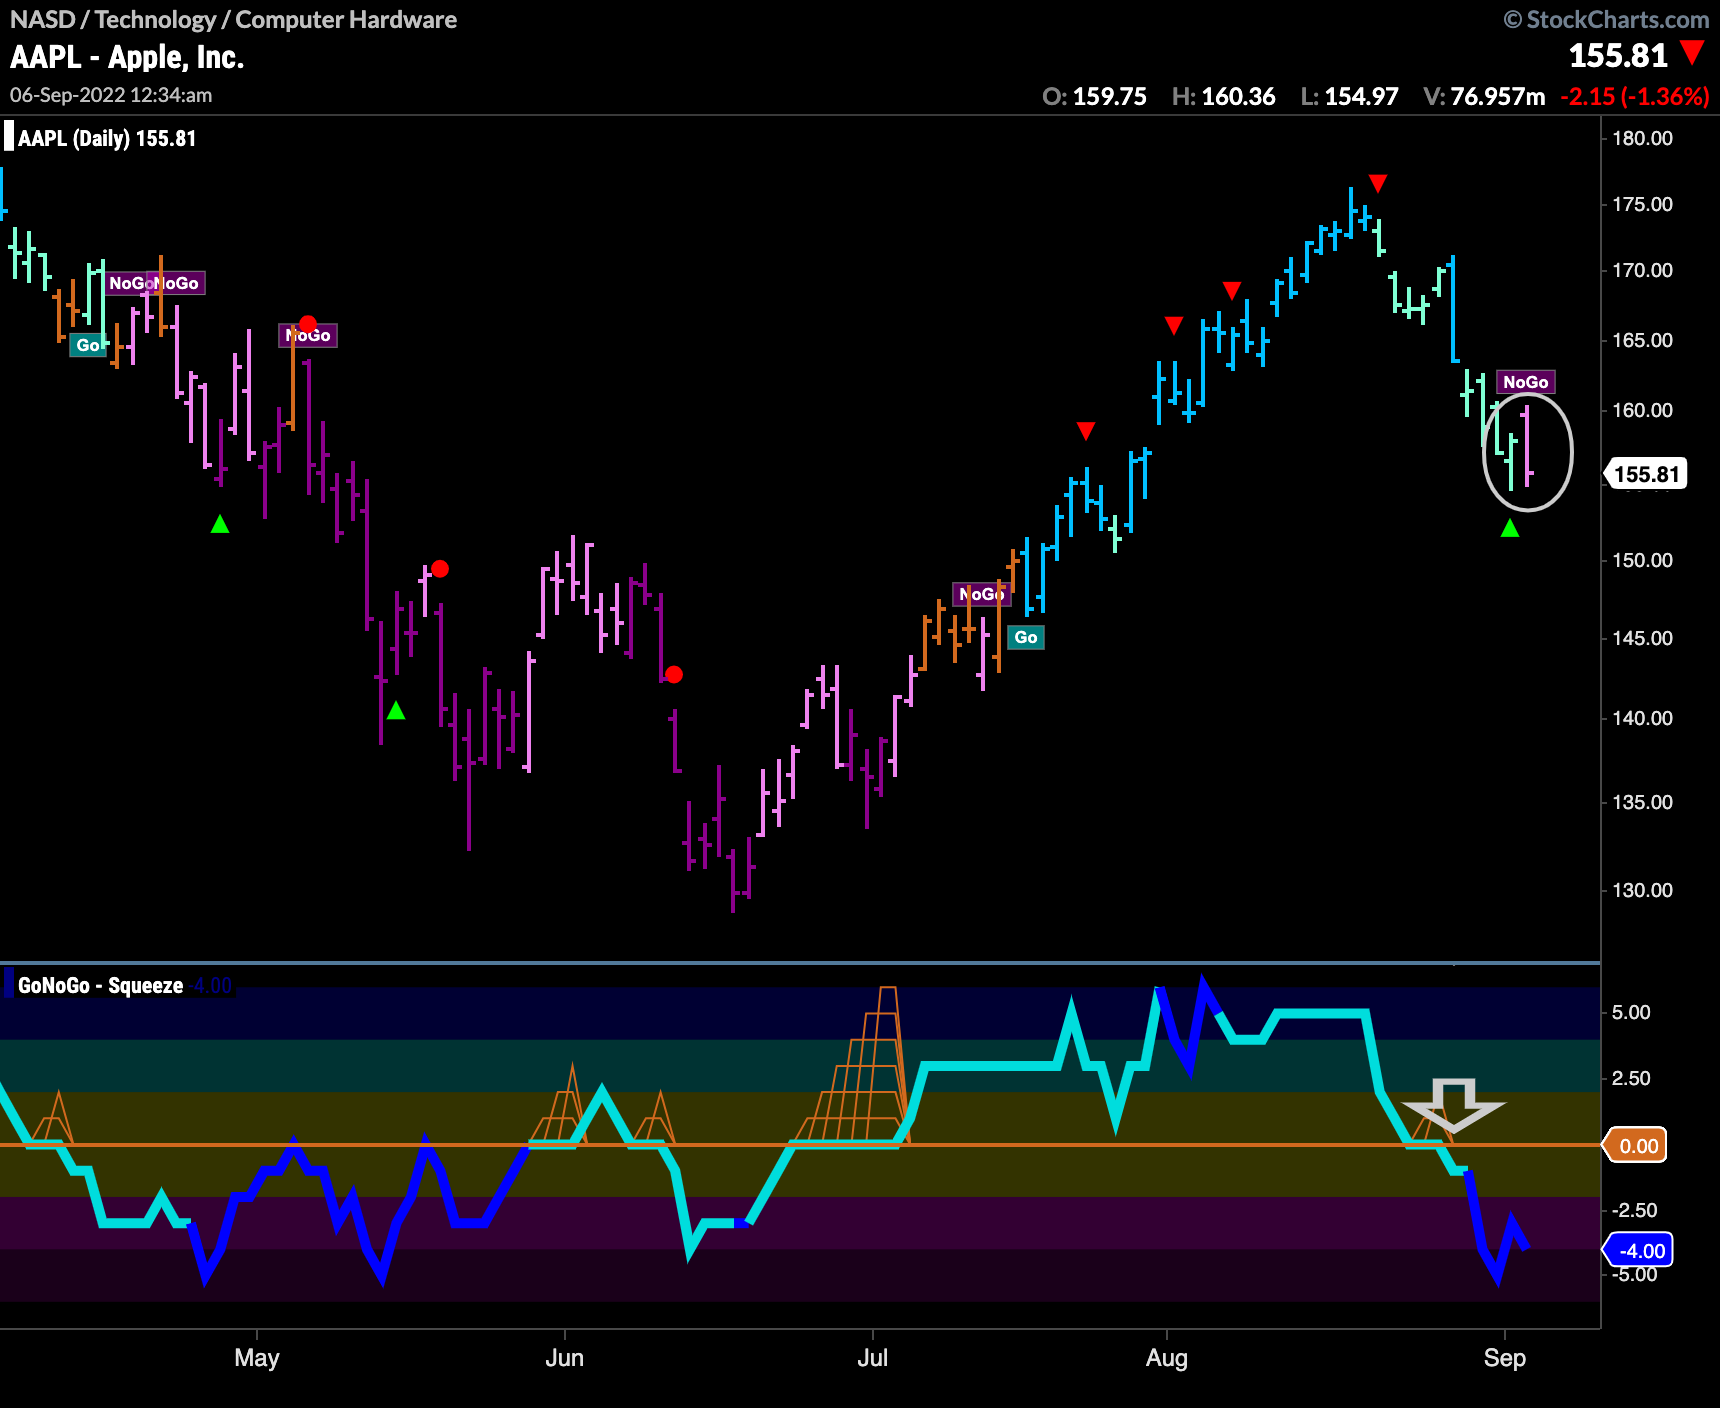
On the daily chart below, we can see the “NoGo” return as well! As we noted with $XLK above, GoNoGo Oscillator tipped us off to this changing trend environment when it broke below the zero line several bars ago. As price continued to fall, we saw GoNoGo Oscillator turn dark blue, indicating heavy volume, strong market participation in the move lower. Finally, GoNoGo Trend has painted a pink “NoGo” bar.
20220909


