Flight Path – March 3rd 2021

| It is tempting to follow the herd into TopShot, Gamestop, or silicon valley unicorns. These are exciting times with widespread participation in an early-stage bull market. Technical Analysis is an incredible tool for separating what people are talking about, from what investors are buying.As Walter Deemer says, “watch their feet, not their mouths.”So, let us pay close attention to the new leadership groups as the economy comes back online after a world-altering pandemic year. Rotation away from growth, into value, and rotation away from technology and into industrials are key themes that will play out in the months ahead. Below is your Flight Path weekly newsletter for March 1, 2021. |
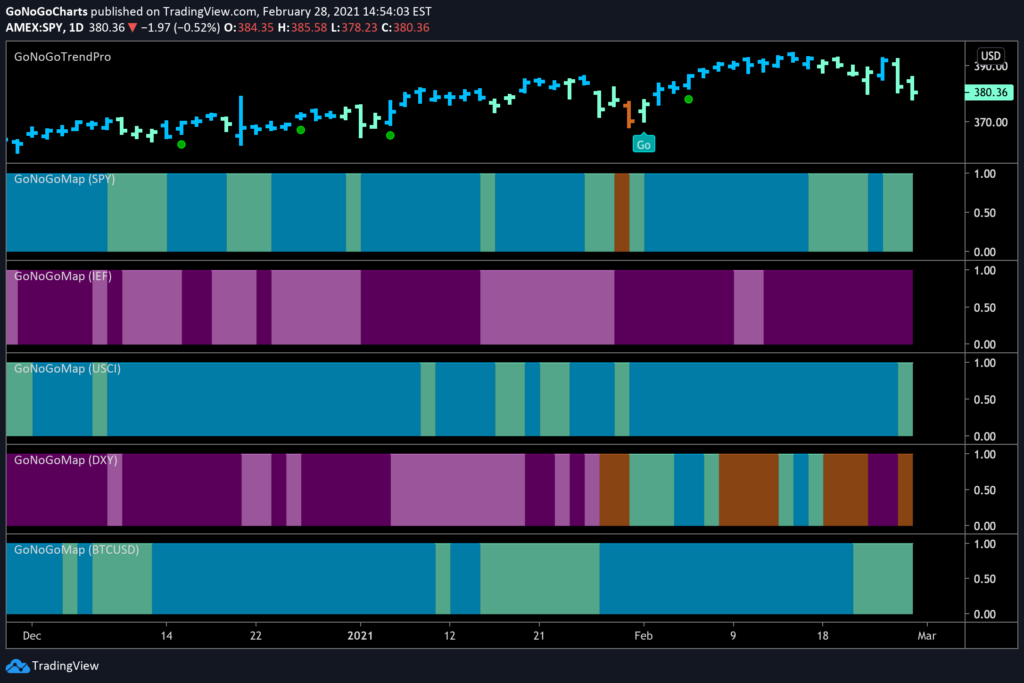
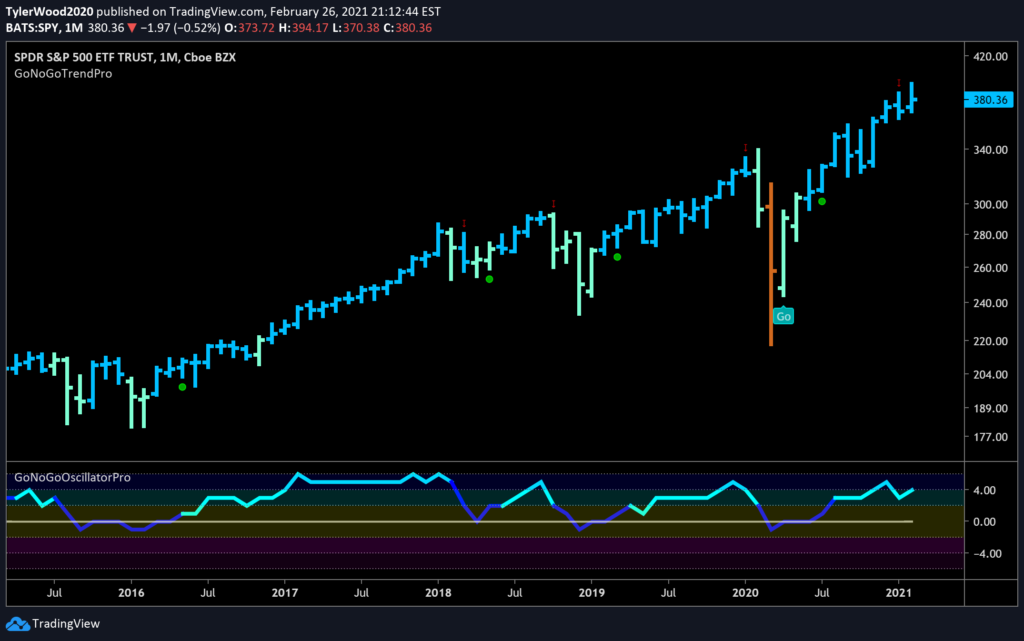
The GoNoGo Heat Map® above shows us the daily trend performance of five asset classes: Equities, Bonds, Commodities, Currencies, and Digital Assets from the US perspective. The takeaway remains the same as it has been for several months. Equities, commodities, and the cryptocurrency markets are still in established “Go” trends. Panel 1 – Stocks continue to paint aqua “Go” bars as the trend persists. The $SPY ETF seeks to provide investment results that correspond generally to the price and yield performance of the S&P. Panel 2 – Government bonds, continue to paint strong purple “NoGo” bars, as investors seek yield elsewhere. $IEF tracks a market-value-weighted index of debt issued by the US Treasury with 7-10 years to maturity remaining. Panel 3 – Commodities are a “Go,” painting blue and aqua bars last week. $USCI tracks an equal-weighted index of 14 commodity futures contracts and holds at least one precious metal, industrial metal, energy, livestock, soft, and grain commodity. Panel 4 – The US Dollar is retreating again from the “Go” trend of the last few weeks and concluded last week’s session with an amber. $DXY is an index of the value of the United States Dollar relative to a basket of foreign currencies. Panel 5 – Bitcoin’s “Go” trend continues though we saw sharply corrective price action last week as it paints aqua bars. EQUITIES FOR THE LONG RUN Stepping back from the daily swings in the market, we can better understand long-term trends from long-term charts. See the monthly GoNoGo Trend chart of the S&P 500 below going back five years. We can better understand how dominant the equity “Go” trend has been coming off the March lows of 2020: |
Energy stocks outperformed as the sector ETF ($XLE) gained 4.3%. Oil prices rose nearly 4% again last week to $61.45 per barrel and we’ll talk more about that when we address commodity trends below. Financials ($XLF) and Communications ($XLC) sectors also outperformed the benchmark, but look at the new leadership emerging in the Industrials sector ($XLI). The continued rotation into cyclical shares only accelerated as vaccine progress fuelled optimism about the reopening of the global economy. |