EUR/USD Chart Analysis Before the ECB Rate Update


Introduction:
The EUR/USD broke above the resistance of a 13-year bear trend line back in July 2020 but is struggling to break back above a previous swing High of 1.25; a level that was set back in early 2018. Price action has made it back up to near 1.23 a couple of times of late but hasn’t managed to get past this region. The ECB rate update is scheduled for tomorrow and this has the potential to impact the next major directional move for the EUR/USD. With this in mind, here is a top down look at the charts with key levels and trend lines noted to monitor with any new reactionary move.
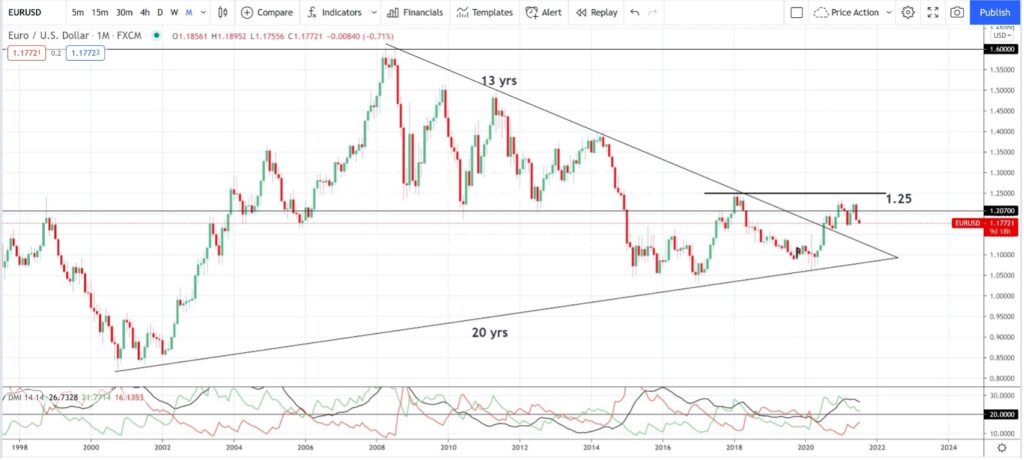
EUR/USD monthly: the monthly chart shows how price action has been in decline since 2008 and this is evident from the print of lower Highs and lower Lows. There was a break of the 13-year bear trend line back in July of 2020 but the EUR/USD has failed to take out the previous swing High level, of circa 1.25, thus far. Any new close and hold above 1.25 would break the pattern of printing ‘lower Highs’ and support the recent trend line break breakout in suggesting that a mean-reversion reversal move might continue.
Any break and move above 1.25 would then bring whole-number regions, on the way up to the previous 2008 High, of circa 1.60, into focus.
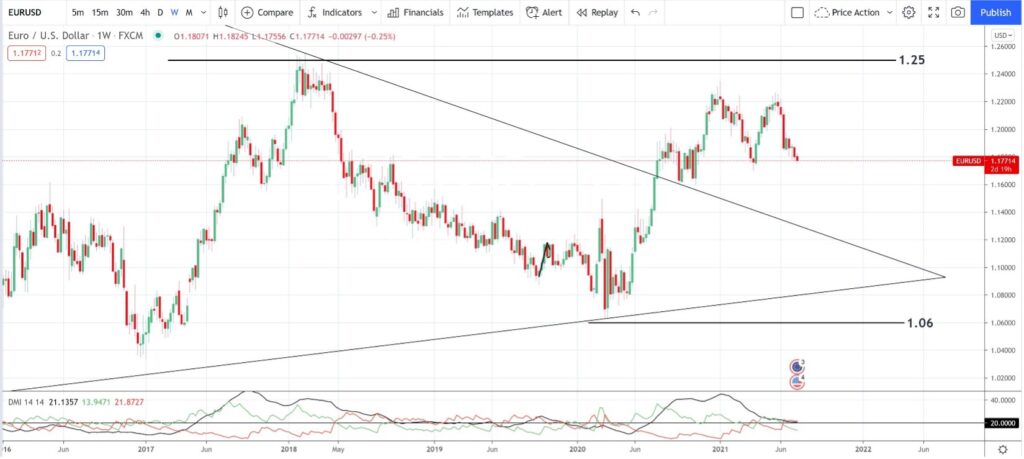
EUR/USD weekly: the weekly chart reveals the breakout above the 13-year bear trend line was triggered in July 2020. Price action has chopped higher since then BUT remains below the previous swing High move of circa 1.25 and so this is the next major resistance level to negotiate.
The EUR/USD has been in retreat over the last 8 weeks or so BUT the momentum indicator, in the bottom pane, shows only a low level of bearish –DMI momentum (red line) and declining overall ADX momentum (black line). Any continued bearish retreat from current levels would bring whole-number levels into focus, as well as the two different trend lines, on the way down to the recent Low, near 1.06. Any break below 1.06 would bring the 2018 Low region, near 1.035, into focus.
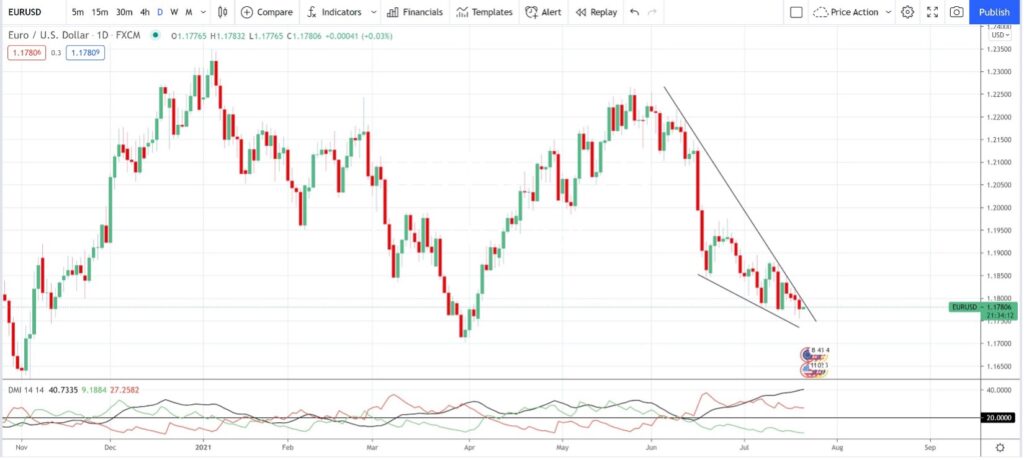
EUR/USD daily: Drilling down to the daily chart shows that price action has been setting up over the last few weeks within a Descending Wedge. These patterns are bullish-reversal patterns and, in my experience, they are one of the most high probability chart patterns of them all. Is this a guarantee that price action will break to the upside? Of course not, but traders are well advised to keep an open mind about the possibility of a bullish shift here, if and when, a trend line breakout does evolve.
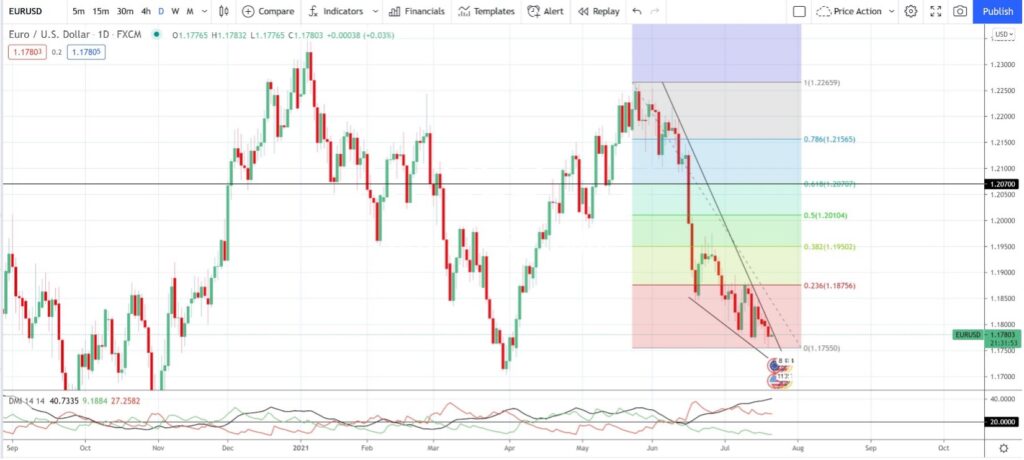
EUR/USD daily + Fibonacci: Fibonacci retracement is a useful tool to apply to chart patterns to help locate targets for any breakout move. A popular Fibonacci level is the 61.8% region and you can view many chart examples of the success of this level through this link.
Application of a Fibonacci retracement to the swing Low move of the Descending Wedge shows the 61.8% region to be up near the 1.207 level. Note how 1.207, which might seem like a random number, also appears to be a region of recent reaction for the EUR/USD so this is added confluence for this Fibonacci level.
Any bullish continuation above 1.207 would then bring the previous High region, near the 100% Fibonacci level, of circa 1.226, into focus. After that, watch whole numbers up to the previously noted 1.25.
The ADX is worth noting here as well given that bearish –DMI momentum is waning and this is another clue that this current bearish move may be due a pause.
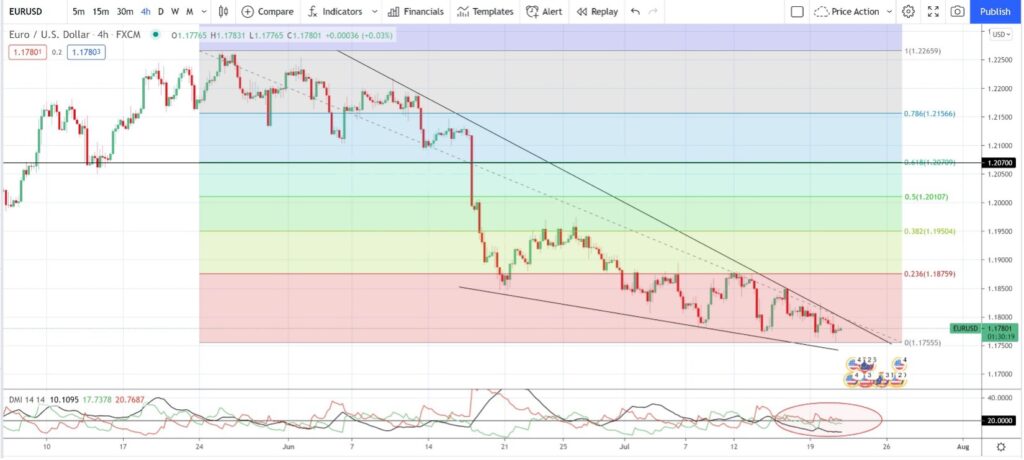
EUR/USD 4hr + Fibonacci: The 4hr chart shows this Descending Wedge more clearly with the 61.8% target near 1.207. This view also shows how price action has been choppier in its recent path lower. It is of no surprise, then, that the ADX momentum indicator is well below the 20 threshold level and is still trending lower for now. An ADX below 20 level means there is essentially no overall trend. The Bearish –DMI is above 20, but only just, and trading sideways and bullish +DMI is just below the 20 threshold.
EUR/USD traders should watch for any new trend line breakout that is supported by increased momentum. That is, watch for the following setups:
- Bullish breakout: Any bullish trend line breakout to evolve with an ADX move above 20, and to trend higher, and the +DMI (green) indicator move above 20, and to trend higher.
- Bearish breakout: Any bearish trend line breakout to evolve with an ADX move above 20, and to trend higher, and the -DMI (red) indicator move above 20, and to trend higher.
Final comments: The EUR/USD is consolidating within a Descending Wedge ahead of tomorrow’s ECB rate update. Key levels to monitor for any bullish or bearish breakout were identified in the article and are summarised below:
Bullish targets:
- 1.207: the 61.8% Fibonacci retracement of any bullish Descending Wedge breakout.
- 1.226: the 100% Fibonacci level of any bullish Descending Wedge breakout.
- 1.25: the whole-number level near the previous 2018 High region.
- Any break and move above 1.25 would bring whole-number regions on the way up to the previous 2008 High of circa 1.60, into focus.
- 1.60: the whole-number near the 2008 High.
Bearish targets:
- 1.06: a recent 2020 Low.
- 1.035: a 2018 Low.
About the Author:
Mary is a technical analyst and private trader based In Sydney, Australia and a member of the Australian Technical Analysts Association (ATAA). More information about her analysis and trading style can be found at Tradecharting.com.
Mary McNamara