DXY Update Following FOMC

The US$ index, DXY, got a boost on Wednesday after the US Federal Reserve signaled that interest rates might be lifted earlier than previously stated. In this article I review the current charts of the DXY and suggest the resistance levels to monitor in coming sessions. This technical analysis is approached with a top-down view by first assessing the monthly chart before drilling down to the daily chart. The charts are fairly clean apart from a few trend lines and a momentum indicator; the ADX in the bottom pane of the chart. This article might be of some interest to those who trade commodities and commodity currencies due to the impact the DXY can have on these trading instruments.
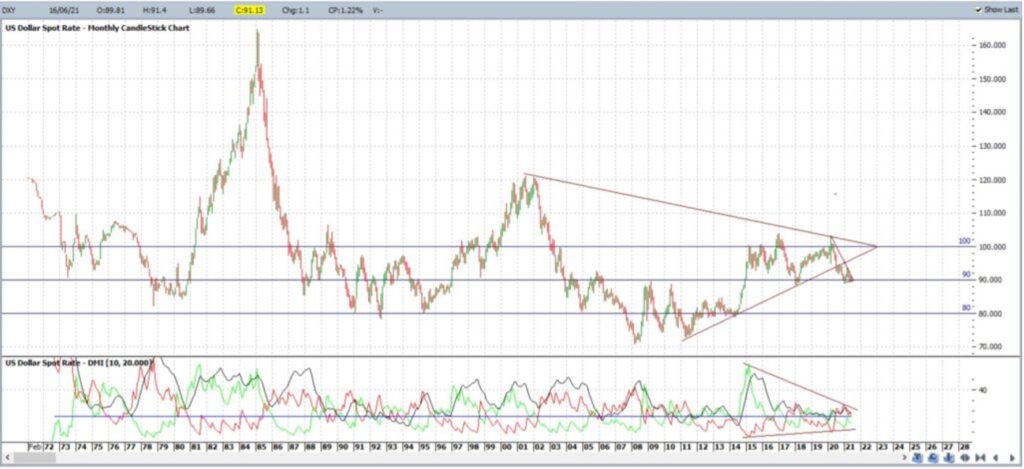
DXY monthly: this longer-term perspective shows how the index has spent a lot of its trading range between the 100 and 80 levels and, at a glance, more of this time seems to be between the 90 and 100 levels than between the 90 and 80 levels. The 90 level can be clearly seen as a reaction zone for the index with many touches over the recent decades.
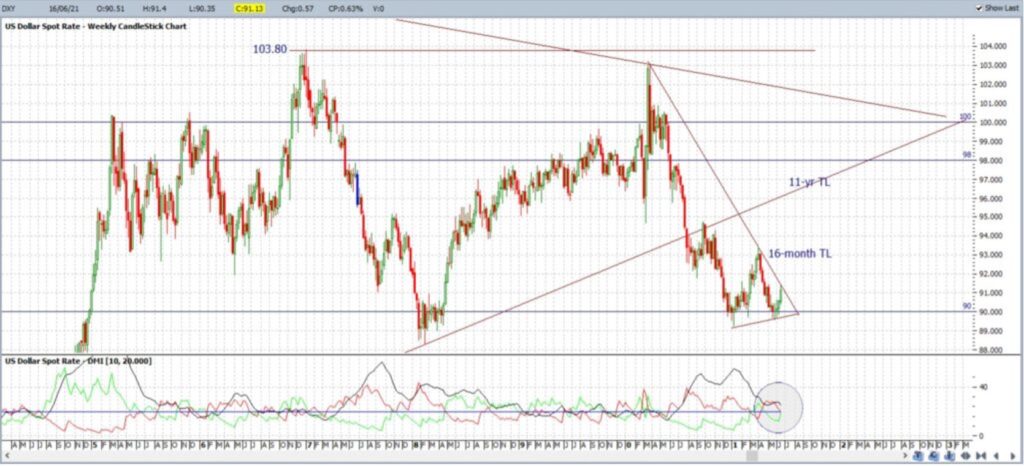
DXY weekly: the most recent High for the index was back in March 2020 where it reached up to near the January 2017 High of 103.80. However, price action declined after that, as seen with the print of lower Highs and lower Lows, until December 2020 at which time the 90 level was reached. The 90 level has been effective support since that time and remains as the main support level to keep monitoring.
This pullback is captured within a triangle pattern and the index is now testing the upper triangle trend line following the boost from last night’s FOMC. This bear trend line is of 16-months duration and traders should watch to see where the current weekly candle closes and whether it makes any bullish trend line breakout.
Momentum will be key to monitor here though as, for now, overall ADX momentum is edging lower. Bullish +DMI momentum is below the threshold 20 level, albeit on the rise, and bearish -DMI momentum is heading down to 20 and is on the decline so watch for any 20 level crossover here. Traders should watch for any weekly chart trend line breakout that is supported by a rising ADX, that is above 20, and a rising +DMI, that is above 20.
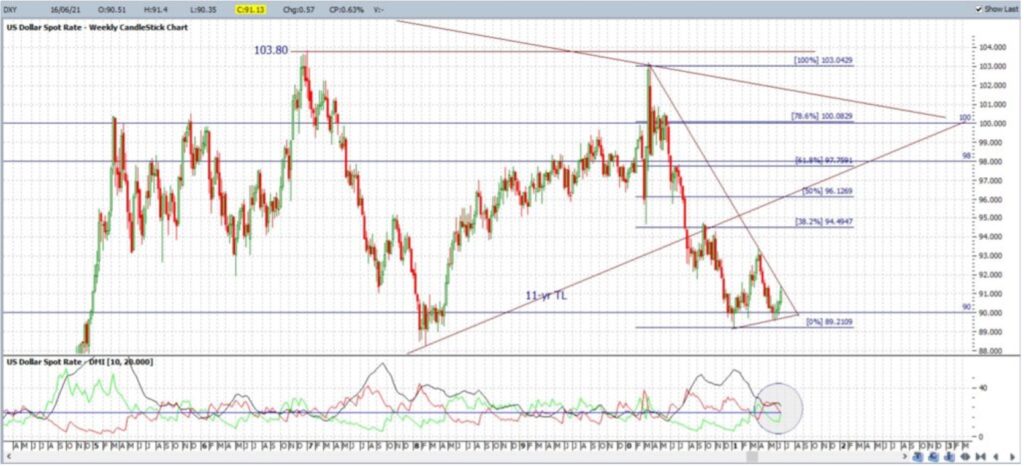
DXY weekly + Fibonacci retracement: Fibonacci retracement is a useful tool to help assess breakout targets. The 61.8% Fibonacci level is a popularly used target and lies near 98 for this last swing Low move on the DXY ( March 2020 – January 2021). Thus, 98 would be the main target for any momentum-based weekly trend line breakout. Any continuation above 98 would bring the whole-number 100 into focus followed by the next weekly chart bear trend line and, then, the previous High, circa 103.80.
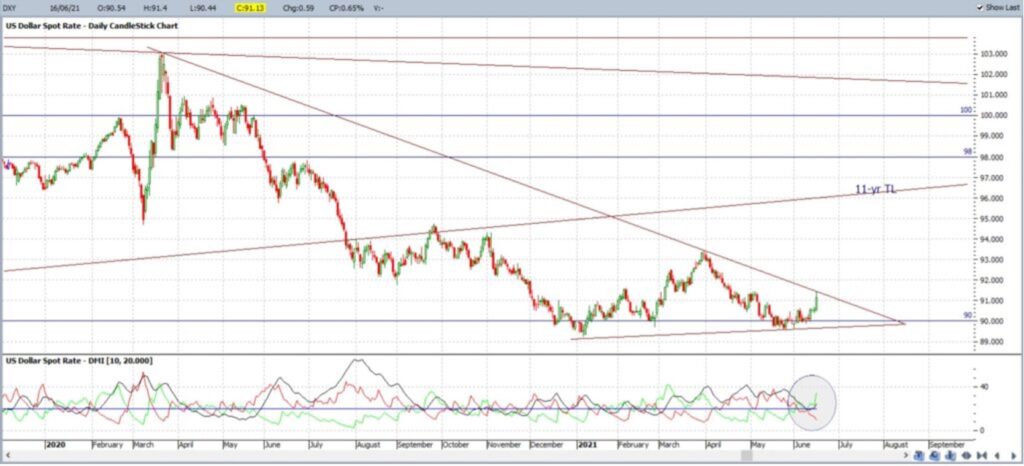
DXY daily: the support of the 90 level can be clearly seen on the daily chart as can the new interaction with the triangle’s bear trend line. Note how ADX and bullish +DMI momentum is above 20 and on the rise on the daily time frame so watch for any flow-through to the weekly time frame. Another potential resistance zone could be the previously broken 11-year support trend line so keep that in mind as well:
DXY daily+ Fibonacci retracement: The 61.8% Fibonacci sits near 98 and this level can also be seen to be a clear reaction zone for the DXY thus acting as some extra confluence for the focus on this target region.

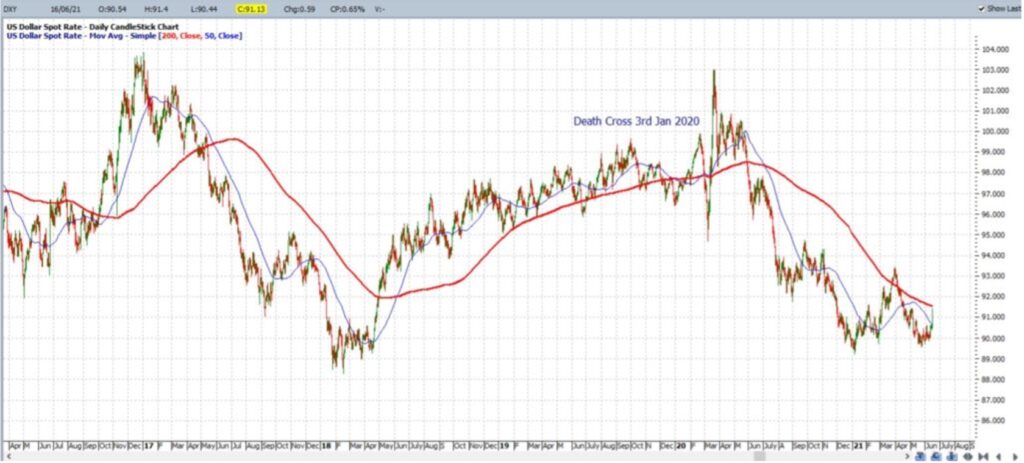
DXY daily Golden and Death Cross: another metric that some traders watch is for Golden and Death crosses. These trigger when there is a cross of the 200 and 50 Moving Average (MA). The most recent such cross for the DXY was a bearish Death Cross, the 50 MA crossed below the 200 MA, and this triggered around January 3rd 2020. These crosses are reasonable signals of bullish and bearish follow-through so traders should watch for any new Golden Cross on the DXY. A Golden Cross would trigger if the 50 MA (blue line) crossed up above the 200 MA (red line).
Putting it all together:
The DXY received a boost following Wednesday’s FOMC but remains range-bound in a weekly triangle pattern and above 90 support for the time being. Any momentum-based bullish trend line breakout would bring the following levels into focus:
- * the previously broken 11-yr support trend line.
- * the 61.8% Fibonacci level, near 98 S/R.
- * a weekly chart bear trend line.
- * the whole-number 100 level.
- * the previous High, circa 103.80.
The DXY remains within a Death Cross for the time being but traders should also be on the lookout for any new Golden Cross.
About the Author:
Mary is a technical analyst and private trader based In Sydney, Australia and a member of the Australian Technical Analysts Association (ATAA). More information about her analysis and trading style can be found at Tradecharting.com.
Mary McNamara


