Daily TA & Trade Ideas – 2nd Mar 2021


US dollar continues higher beating Trend line & MA resistance on the 4 hour chart.
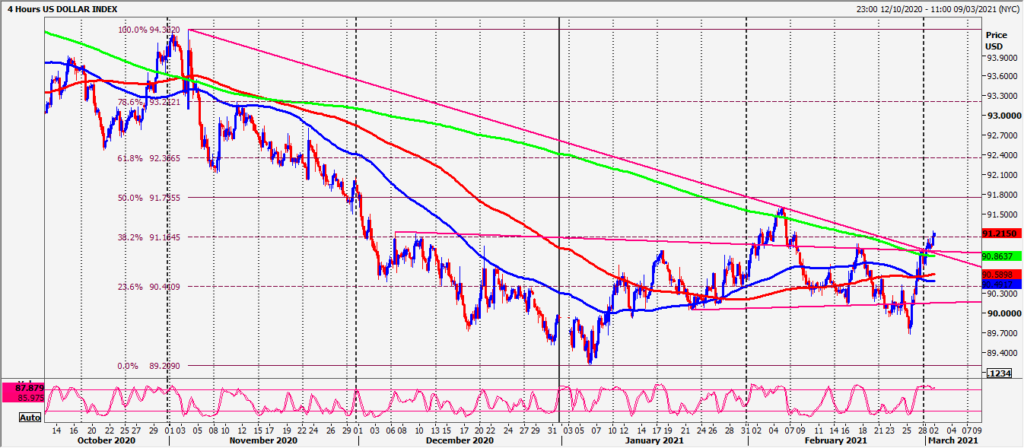
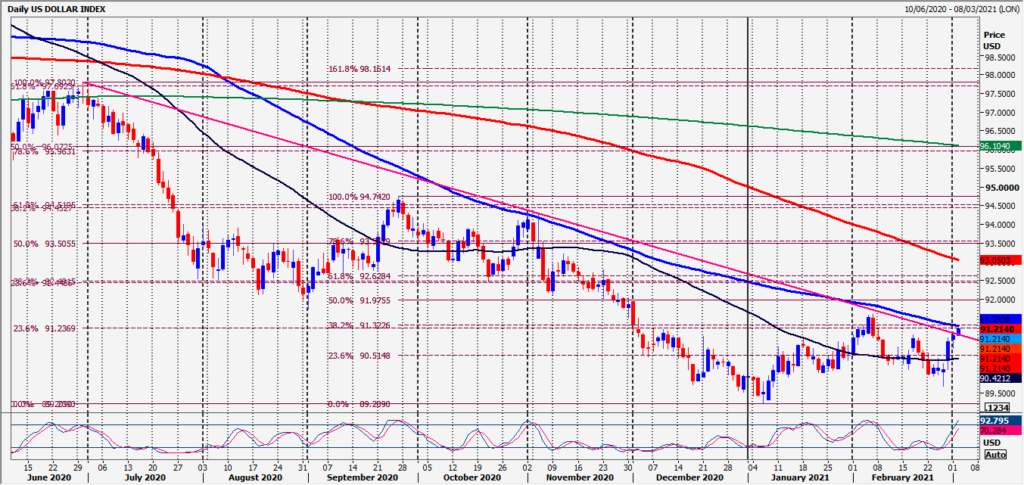
We have also broken above trend line resistance at 91.10 on the daily chart but we wait for a break above the Fibonacci & 100 day moving average resistance at 21.20/30 for a clear medium term buy signal. A crucial day, where we discover if the trend has reversed. A break above the February high at 91.60 then acting as another buy signal initially targeting 9240/50.
AUDUSD outlook negative after a negative shooting star on the monthly chart, bearish engulfing candle on the weekly chart & bearish engulfing candle on the daily chart from Friday.
NZDUSD negative shooting star candle on both monthly & weekly chart signals the end of the 1 year bull run for now. Outlook is neutral/negative.
USDJPY tests 3 week trend line resistance at 105.65/75.
EURJPY in a 9 month bull trend so we remain buyers on weakness. We topped exactly at first resistance at 128.90/80 & bottomed exactly at first support at 128.20/00.
CADJPY bounced 10 pips above best support for the day at 8350/35 & shot higher to 8453.
EURUSD has collapsed back to the 2 week low at 1.2020. Holding below the 100 day moving average at 1.2030 is more negative for today.
USDCAD bullish engulfing candle signalled the end of the bear market on the daily chart last week with a bullish engulfing candle on the weekly chart now acting as a further buy signal.
Gold Spot we wrote: Outlook remains negative! Sell on a bounce.
We topped exactly at the break point selling opportunity at 1755/60. Shorts worked perfectly on the 45 point collapse & the outlook remains negative so hold the shorts.
Gold Spot we wrote: Outlook remains negative! Sell on a bounce.
We topped exactly at the break point selling opportunity at 1755/60. Shorts worked perfectly on the 45 point collapse & the outlook remains negative so hold the shorts.
Silver Spot breaks below 2630/20 for a sell signal.
WTI Crude APRIL Future small rounding top pattern did send prices a little lower but the more important head & shoulders pattern did complete for a sell signal.
We held just 19 ticks above resistance at 6300/20 to form the right shoulder as we suspected then broke the neckline at 6140/30 for the sell signal. we are now 150 ticks lower.
Emini S&P March unexpectedly shot higher to recover much of Thursday’s steep losses reaching 3912.
Nasdaq March missed our selling opportunity at 13350/450 by 22 ticks. Emini Dow Jones March unexpectedly rocketed after significant negative signals regaining all of Friday’s losses.
| AUDUSD | outlook negative after last week’s sell signals. |
| AUDUSD | Sell 7765/75. Stop above 7790. Strong resistance again at 7830/50 |
| NZDUSD | outlook negative after last week’s sell signals. |
| NZDUSD | Sell at 7280/7300 stop above 7325. Sell 7355/70 stop above 7385 |
| USDJPY | 500 dma at 107.25/35. Try shorts with stops above 107.55. |
| USDJPY | buy 105.80/70 stops below 105.60. |
| EURJPY | good support at 128.10/127.90. Longs need stops below 127.70. |
| CADJPY | buy at 8350/35. Longs need stops below 8320. |
| EURUSD | sell at 1.2090/1.2110. Shorts need stops above 1.2125. |
| USDCAD | buy 1.2650/30 with stops below 1.2600. |
| GBPUSD | buying opportunity at 1.3820/00. with stops below 1.3780. |
| GBPUSD | A break lower is a medium term sell signal. |
| Gold | outlook remains negative. Shorts at 1755/60 worked perfectly (hold them) |
| WTI Crude | outlook negative. first resistance at 6020/40. Strong resistance at 6160/80 |
| WTI Crude | buying opportunity at 5680/60 with stops below 5620. |
| Nasdaq | key resistance at 13350/450. |
| USDZAR | buy 1500/1490 with stops below 1475. |
| USDZAR | be ready to buy a break above 1525. |