Daily TA & Trade Ideas – 27th Feb 2021

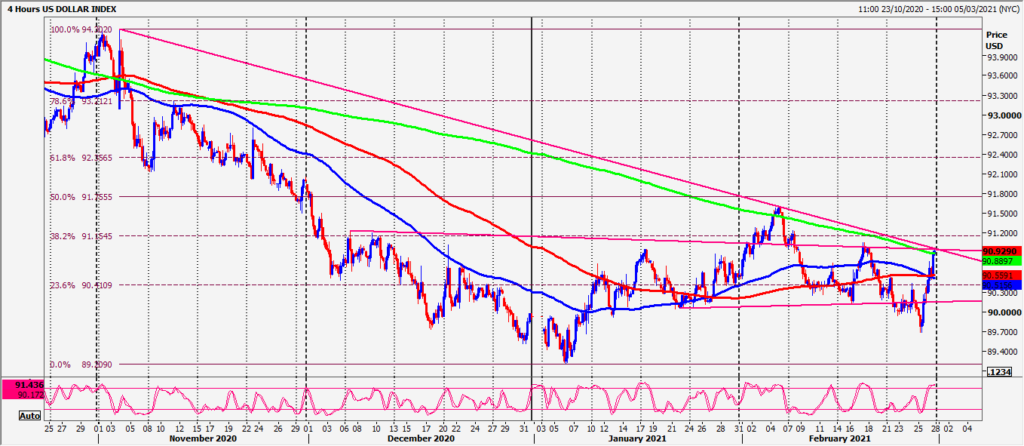
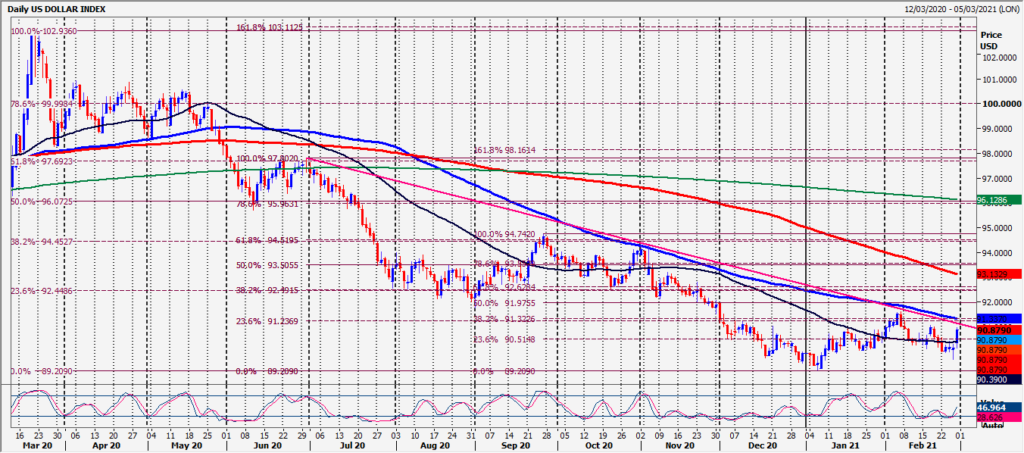
The US dollar has been all over the place this year in what currently looks like a consolidation phase in a 1 year bear trend. No bullish pattern yet but we have a bullish weekly candle after a new February low last week, followed by a close near the high.One candle does not mean the trend has been reversed. We are testing strong resistance at 90.90/95 on the short term charts.

Stronger resistance a little higher at 91.15 from an 8 month trend line plus Fibonacci & 100 day moving average at 91.20/30. I can only turn longer term bullish on a break above the February high at 91.60. Until then I will sell in to resistance assuming the odds remain for a resumption of the bear trend.

Looks like 10 year yields must hold above support at 1.4380 to remain in the strong 7 month bull trend, although so far these rising yields have not had a positive effect on the dollar.
AUDUSD has wiped out 2 weeks of strong gains in less than 48 hours. On the monthly chart we have a negative shooting star, the weekly chart a bearish engulfing candle, the daily chart a bearish engulfing candle from Friday.
We broke 7770/60 for a sell signal targeting 7700/90 & bottomed exactly here.
NZDUSD unexpectedly wiped out early gains from last week after the bullish breakout. A negative shooting star candle on both monthly & weekly chart signals the end of the 1 year bull run for now.
We broke best support at 7290/80 for a sell signal targeting 7240/30 & held half way to the next target of 7210/00.
USDJPY beat resistance at 106.00/10 for the next target of 106.40/45 but I have spotted 3 week trend line resistance at 105.65/75 so this is key to direction on the open.
EURJPY beat 128.45 for a buy signal targeting 128.65/75, 129.30/40 & 129.80/90.
All targets hit for a potential 180 pip profit before we unexpectedly collapsed 135 pips. We are in a 9 month bull trend so remain buyers on weakness.
CADJPY bottomed exactly at best support at 8400/8380 but no bounce on Friday. We are in a 10 month bull trend so remain buyers on weakness.
EURUSD remains very difficult to trade with no swing trade opportunities because we cannot hold in 1 direction for more than 2 days.
The outlook remains unclear with no trend or pattern to follow so I can only suggest scalping levels.
USDCAD bullish engulfing candle signalled the end of the bear market & we beat strong resistance at 1.2660/70 for another buy signal. Shorts severely squeezed as we shot higher to 1.2748. leaving a bullish engulfing candle on the weekly chart now. Bears will be nervous on the open!
GBPUSD has been in a very strong 11 month bull trend but last week we unexpectedly crashed 350 pips from a mid week higher of 1.4235.
We had resistance at the 6 year 50% Fibonacci & 500 week moving average at 1.4300/1.4350 but i thought we would get closer. Perhaps it was the 100 month moving average at 1.4141 that killed the bulls.
EURGBP more volatile in line with FX markets at the end of the week. Unfortunately we over ran resistance at 8700/8710 by 20 pips before we hit the target of 8660/50.
Gold Spot hovered at key support in the 1770/60 area until mid-afternoon. We wrote: Be ready to sell a break below 1757 targeting 1752/50, 1745/43, 1740 & perhaps as far as 1736/34.
Shorts certainly worked on a quick move to 1736/34 & as far as 1717. Outlook remains negative! Sell on a bounce.
Silver Spot trades sideways but with a more positive bias so this is very different to the Gold chart.
A good chance silver will continue to hold up better in the days ahead. The long silver/short Gold spread has been working for months.
WTI Crude APRIL Future small rounding top pattern did send prices a little lower through 6230/00 but we held 25 pips above strong support at 6100/6080.
Dax 30 March we wrote: Strong resistance at 13870/900 could see a high for the day.
It did!!
Emini Dow Jones March bearish engulfing candle on Thursday followed by the same formation on the weekly chart chart. We took out the previous 13 days of price action leaving a large bear trap so outlook has turned negative.
Nasdaq March broke 12740 for a sell signal but unfortunately this proved to be false as we unexpectedly shot higher to 13089. We are in a 2 week bear trend & I will stick with a negative short term outlook.
| AUDUSD | outlook negative after last week’s sell signals. |
| AUDUSD | Strong resistance at 7755/65, 7800/20 & 7850/80 |
| NZDUSD | outlook negative after last week’s sell signals. |
| NZDUSD | Sell at 7280/7300 stop above 7325. Sell 7355/70 stop above 7385 |
| USDJPY | 3 week trend line resistance at 106.65/75 |
| USDJPY | 500 dma at 107.25/35. Try shorts with stops above 107.55. |
| USDJPY | buy 105.80/70 stops below 105.60. |
| EURJPY | Buy at 127.75/65 with stops below 127.40. |
| CADJPY | buy at 8350/35. Longs need stops below 8320. |
| EURUSD | best support at 1.2060/40. Longs need stops below 1.2025. |
| EURUSD | A break lower is a sell signal targeting 1.1980/70 & 1.1955/45 |
| USDCAD | sell 1.2855/75 stops above the January high at 1.2890 |
| GBPUSD | Best buying opportunity at 1.3790/70 with stops below 1.3750. |
| Gold | outlook negative. Sell a bounce. resistance at 1738/40 & 1755/60 |
| Dax | outlook negative. sell with resistance at 31150/250 & 31450/500. |
| Nasdaq | Outlook negative. Sell at 13050/150 stop above 13200. |
| Nasdaq | Sell at 13350/450 with stops above 13500. |
| USDZAR | buy 1500/1490 with stops below 1475. |


