Bullish Signal for Communication Services


Bullish Signal for Communication Services
Legendary technical analyst Welles Wilder created a number of technical indicators that have become a core part of many traders’ technical toolkits.
From the ADX line to Parabolic Systems to the Directional Movement Index, Wilder truly enhanced the ways that technical analysts can measure trend and gauge price momentum.
Of all of his contributions to the technical indicator library, I have found the Relative Strength Index, or RSI, to be an essential method in my process to evaluate momentum characteristics. More importantly, the RSI allows me to anticipate potential turning points by looking for divergences.
When a stock’s price is going lower, and a momentum indicator like RSI is going higher, you have what’s called a “bullish momentum divergence”. This is often a sign of downtrend exhaustion and can be a great leading indicator for future rallies.
As the major averages have begun to rally in the new year, we are finding a plethora of bullish divergences on individual stocks and ETFs. Does this suggest that conditions are improving for risk assets? We think it does.
For example, let’s review the chart of Amazon.
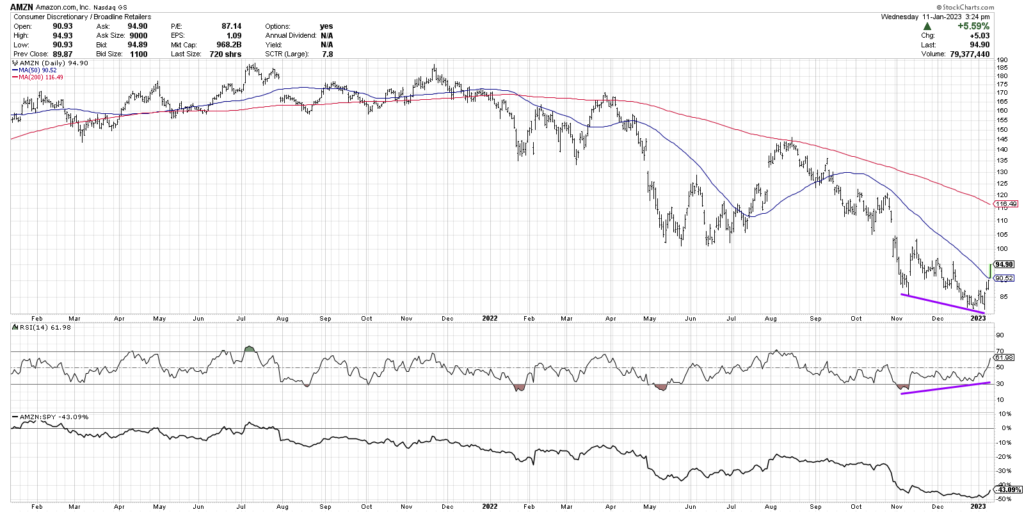
AMZN gapped lower at the end of October 2022, pushing the price under the previous low in June and establishing a new 52-week low for this important mega cap stock.
Then in December, as the major averages were bouncing off their October lows, Amazon was making another new 52-week low. AMZN ended the year down over 50%, far underperforming the S&P 500 and Nasdaq Composite.
Now let’s review the RSI, found in the panel just below the price. Note how at the November low the RSI was below 30 a.k.a. oversold. When the stock made a new low in December, the RSI was above 30.
Here we have a perfect illustration of the bullish momentum divergence, suggesting the downside momentum has alleviated and we may have reached an exhaustion point to the downtrend.
The chart of the Communication Services sector (XLC) showed a similar divergence back in November.
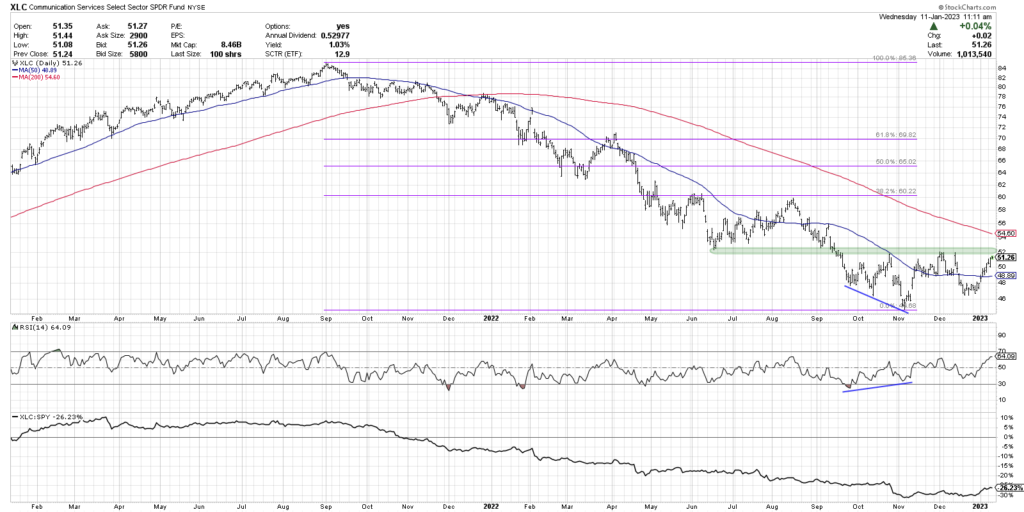
Here we see the price making lower lows in September through November, but the RSI is making higher lows over that same period. Now the XLC has bounced off those lows and is testing price support right at the $52 level.
It’s important to note that the bullish momentum divergence is considered a leading indicator. This means that it often triggers a signal before a price bottom, not after.
Aggressive traders may take a position once the divergence is confirmed and rely on money management rules and stop losses to limit downside risk in case the divergence does not play out.
More conservative investors (like your author) will often wait for confirmation in the form of the price actually following through to the upside.
On the chart of XLC, a valid break above resistance at $52 could certainly provide that bullish evidence to confirm high upside potential.
For deeper dives into market awareness, investor psychology and routines, check out my YouTube channel!
RR#6,
Dave
David Keller, CMT
Chief Market Strategist
StockCharts.com
David Keller, CMT is Chief Market Strategist at StockCharts.com, where he helps investors minimize behavioral biases through technical analysis. He is also President and Chief Strategist at Sierra Alpha Research LLC, a boutique investment research firm focused on managing risk through market awareness. He is a Past President of the Chartered Market Technician (CMT) Association and currently serves on the CMT Curriculum and Test Committee. David was formerly a Managing Director of Research at Fidelity Investments in Boston as well as a technical analysis specialist for Bloomberg in New York. You can follow his thinking at MarketMisbehavior.com, where he explores the relationship between behavioral psychology and the financial markets.
Disclaimer: This blog is for educational purposes only and should not be construed as financial advice. The ideas and strategies should never be used without first assessing your own personal and financial situation, or without consulting a financial professional.
The author does not have a position in mentioned securities at the time of publication. Any opinions expressed herein are solely those of the author, and do not in any way represent the views or opinions of any other person or entity.
20230112